4.3 绘制多面函数图-interactive
Section outline
-
Lesson Objectives
::经验教训目标-
Know and apply the
Remainder Theorem
.
::了解并运用残余定理。 -
Find intervals where the graph of a
polynomial
increases and decreases
, and f
ind the local minimums and maximums of the graph of a polynomial.
::查找多数值增减的图形的间距, 并查找多数值图的本地最小值和最大值 。 -
Find the intervals where the graph of a polynomial is concave up and concave down, and find the inflection point.
::查找多面形图向上和向下粘结的间距, 并找到反向点 。 -
Interpret the characteristics of a polynomial within a real-world context.
::在现实世界背景下解释多元性的特点。 -
Graph a
polynomial function
.
::图形多面函数。 -
Find the local minimums and maximums given the table of a polynomial.
::查找多面体表格中给定的本地最小值和最大值 。
Introduction: The Housing Market
::导言:住房市场Polynomial models are often used to represent real-world data over a specified domain . The polynomial function below has been fitted to the average price of a house in Seattle, Washington, years after 2000.
::多元模型常常用来代表特定域的真实世界数据,以下的多元函数与2000年之后X年华盛顿西雅图一栋房屋的平均价格相符。Discussion Questions :
::讨论问题:-
What happens to the
function
model as the
degree
increases?
::随着度的增加,函数模型会怎样? -
How can this model be useful?
::这一模式如何有用? -
Does there appear to be any restrictions on the domain or
range
?
::是否似乎对该域或范围有任何限制?
Activity 1: Understanding Function Models
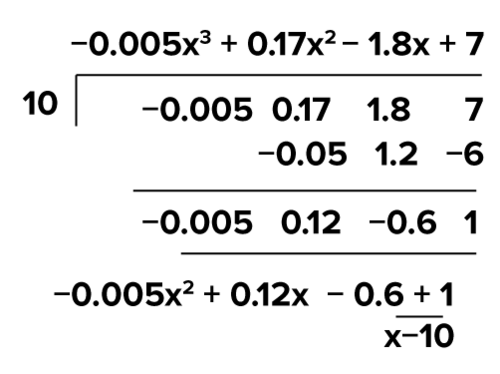
::活动1:了解功能模型The function model below is used to model a person's growth each year, in inches, between the ages of 0 and 18 .
::以下功能模型用于模拟0至18岁之间每年以英寸计的人的成长。
::f( x) =0.005x3+0..17x2 - 1. 8x+7T he output can be obtained when the input is 10 by substituting 10 for in the function:
::当输入为 10 时, 可以通过在函数 x 中替换 10 来获取输出 :
::f( 10) 0.005( 10) 3+0. 17( 10) 2-1.8( 10) +7 0.005- 1000+0.17_ 100- 1.8( 10) +7_ 5+17- 18+7=1The input-output pair means that a ten-year-old is predicted to gain 1 inch from their 10th birthday to their 11th birthday.
::投入-产出对f(10)=1意味着10岁的孩子从10岁生日到11岁生日预计会增加1英寸。Recall the R emainder T heorem from Synthetic Division :
::回顾合成组的遗物定理:The Remainder Theorem
::遗物定理If a polynomial of degree is divided by the remainder, is a constant and is equal to the value of the polynomial when is substituted for That isThis theorem can be used to find which will equal the remainder of when divided by This theorem allows you to use synthetic division to find the output of a function given a specific input.
::此定理可用于查找 f(10), 当除以 x- 10 时, 等于 0.005x3+0. 17x2 - 1. 8x+7 的剩余值。 此定理允许您使用合成分区查找函数的输出, 并给定特定的输入 。Answer the questions below to practice finding and analyzing input-output pairs.
::回答以下关于实践发现和分析投入-产出对对的问题。Discussion Question : How can the remainder theorem help graph a polynomial function?
::讨论问题:其余的定理如何帮助绘制多元函数图?
Activity 2: Polynomial Functions in Business
::活动2:企业中的多功能P olynomials are often used to model the revenue , cost, and profit of a business. T his can be taken a step further by analyzing the properties of these and discussing what they mean in context.
::多边协议常常被用来模拟企业的收入、成本和利润。 这可以通过分析这些企业的特性和讨论它们在上下文中的含义而更进一步。Example
::示例示例示例示例A furniture company performed an analysis on one of the couches they sell. The revenue as a function of selling couches can be modeled by the function The monthly cost of selling couches can be modeled using Interpret the profit function of selling couches.
::一家家具公司对其出售的沙发之一进行了分析,销售x沙发的收入可以通过功能R(x)=47x2-x3来模拟,出售x沙发的月成本可以用C(x)=239x+287来模拟,解释出售x沙发的利润功能。The profit function can be determined by subtracting the cost function from the revenue function:
::利润职能可通过从收入职能中减去成本职能来确定:
::P(x)=R(x)-C(x)-C(x)-P(x)=(47x2-x3)-(239x+287)-(x)-(x)-(x)x3+47x2-239x-287)The profit function is a cubic function and is graphed below. Use the interactive to examine the properties of the cubic profit function and examine how that function relates to the revenue and cost functions.
::利润函数为立方函数,如下图所示。使用互动功能检查立方利润函数的属性,并审查该函数与收入和成本功能的关系。Discussion Question : How does the graph of the revenue and cost functions relate to the profit function?
::讨论问题:收入和成本职能图表与利润职能有何关系?
Activity 3: Graphing a Higher Degree Polynomial
::活动3:绘制高学位多面图Use the interactive below to plot the given polynomial. Plot points to graph the function. You may have to evaluate input values between the integers to get a better sense of how the graph looks.
::使用下面的交互作用来绘制给定的多面性。 绘图点可以绘制函数的图形。 您可能需要评估整数之间的输入值, 以便更好地了解图形的外观 。
Wrap-Up: Review Questions
::总结:审查问题Summary
::摘要-
One way to graph a polynomial function is by plotting points.
::绘制多数值函数图的方法之一是绘图点。 -
The remainder theorem can be used to help plot points on a graph.
::其余的定理可用于帮助图形上的绘图点 。 -
The remainder theorem states that if a polynomial
of degree
is divided by
the remainder,
is a constant and is equal to the value of the polynomial when
is substituted for
That is
::其余的定理表示,如果以x-c为单位,则以x/n >0度(x)倍数除以x/x,则其余的R为常数,当以c替代x时,该值等于多数值。这就是f(c)=R。 -
A local maximum occurs when a function changes from increasing to decreasing. A local minimum occurs when a function changes from decreasing to increasing.
::当函数从递增到递减之间发生函数变化时,即发生局部最大值。当函数从递减到递增之间发生函数变化时,即发生局部最低值。
To help when graphing polynomials:
::帮助绘制多面形图时:-
Find the intercepts.
::寻找拦截。 -
Is it concave up or concave down?
::是上层还是下层? -
Where is the function increasing
or
decreasing?
::职能在增加或减少的方面在哪里? -
Find the local minimums and maximums.
::找到本地最低限值和最高限值。
-
Know and apply the
Remainder Theorem
.