5.6 日志函数的转换-interactive
章节大纲
-
Lesson Objectives
::经验教训目标-
Locate and identify the domain
,
range, and intercepts of a logarithmic function.
::定位并识别对数函数的域、范围及拦截。 -
Identify the effect of a transformation on the graph of a logarithmic function.
::识别对数函数图形上的变换效果。 -
Transform the graph of a logarithmic function.
::转换对数函数的图形。
Introduction: Seismic Activity
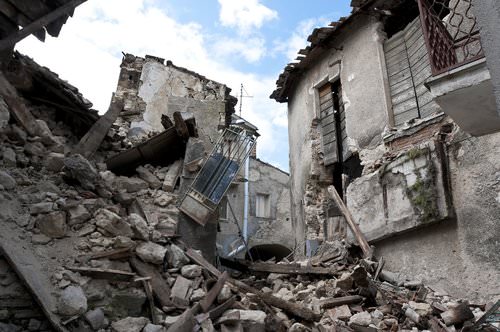
::导言:地震活动Earthquake damage
::地震地震损坏In 1935, the American Seismologist Charles Richter created the Richter scale to quantify the magnitude of an earthquake. Richter found that most earthquakes were relatively small, causing little to no damage. However, some earthquakes were so large that he had trouble putting them on the same scale. As a result , he created a logarithmic scale to measure the magnitude in powers of ten. This means that each level is ten times stronger than the previous level. So an earthquake rated at 6.0 is 10 times more powerful than an earthquake rated at 5.0.
::1935年,美国地震学家查尔斯·里希特(Charles Richter)创建了里氏级,以量化地震的规模。里氏发现大多数地震相对小,几乎没有造成任何破坏。然而,一些地震如此之大,以至于难以将地震置于同样的规模上。因此,他创建了一个对数级,以测量十倍功率的大小。这意味着每层都比前一级强十倍。因此,被评为6.0的地震比被评为5.0的地震强十倍。1.0 Occurs d aily Little to no damage 2.0 Occurs d aily Little to no damage 3.0 Occurs d aily Minor damage 4.0 Occurs d aily Minor damage 5.0 Occurs m onthly Strong damage 6.0 Occurs m onthly Strong damage 7.0 Occurs m onthly Severe damage 8.0 Occurs yearly Very severe damage 9.0 Occurs yearly Very severe damage 10.0 Occurs once every 1,000 years Extreme Damage This scale is determined using the following formula:
::该比额表采用下列公式确定:
:MI)=log(AA0)
-
is the magnitude
::M(I) 是星号 -
is the intensity
::A 是强度 -
is the minimum intensity that can be felt based on proximity
::A0是近距离能感觉到的最低强度 -
The base is 10
::基数是10
This function takes in amplitude and produces magnitude. However, a 7.0 in Egypt doesn't necessarily feel like a 7.0 in France. As the distance from the epicenter increases, the relative magnitude decreases. The transforms the function, accounting for distance from the epicenter of the earthquake. T his section will explore how log functions can be transformed to represent a relationship. Use the interactive below to explore the relationship between intensity and magnitude further.
::此函数以振幅表示, 并产生音量。 然而, 埃及的7. 0 在法国不一定感觉像 7. 0 。 随着震中距离的增加, 相对音量会下降。 A0 将函数转换为与地震震中距离的函数。 本节将探索如何转换日志函数来代表关系。 使用下面的交互作用来进一步探索强度和音量之间的关系 。
Activity 1: Observing Changes in the Transformation of Logarithmic Functions
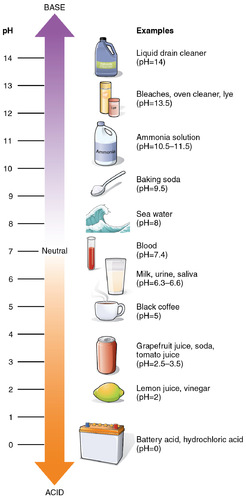
::活动1:观察对数函数转换的变化The acidity or alkalinity of a solution is measured based on the concentration of Hydrogen. This measurement is called the pH. A logarithmic scale is used to measure pH by powers of 10.
::溶液的酸度或碱度是根据氢的浓度测量的,这种测量称为pH值。用10的功率测量pH值时使用了对数尺度。Alkaline is also referred to as base . A solution with a pH of 4 is 10 times more alkalinic than a solution with a pH of 3. Likewise, a solution with a pH of 3 is 10 times more acidic than a solution with a pH of 4. The pH of a solution is calculated using the following formula:
::碱碱也称为碱基。pH值为4的溶液,碱性比pH值为3的溶液高10倍。同样的,pH值为3的溶液,酸性比pH值为4的溶液高10倍。 溶液的pH值使用以下公式计算:
::pHlog(H+)-
is the level of acidity or alkalinity measured on a scale from 0 to 14.
::pH是按0至14的尺度测量的酸度或碱度水平。 -
is the concentration of hydrogen ion.
::H+是氢离子的浓度。
Use the graph of the equation to help answer the following questions.
::使用 ylogx 等式的图形来帮助回答下列问题。Discussion Question :
::讨论问题:-
What does a negative logarithm value represent?
::负对数值代表什么 ? -
What you think the difference is between
and
::你认为区别在于 ylogx 和y=log(-x)?
Use the interactive below to explore further how different transformations affect the graph of a logarithm.
::使用下面的交互效果来进一步探索不同变换如何影响对数图。Discussion Question : When comparing the two equations and notice that the coefficient of in the second equation is three times bigger than the coefficient of in the first equation. How would you explain what is different about the second graph in terms of it shrinking or stretching? Explain why this is the case. Does this mean the output values for will be triple those of
::讨论问题: 当比较两个方程式 f( x) = log2 ( x) 和 g( x) = log2 ( 3x) 时, 注意第二个方程式中的 x 系数比第一个方程式中的 x 系数大三倍。 您如何解释第二个图在缩缩缩缩或伸展方面有什么不同? 解释为什么会这样? 这表示g( x) 的输出值是 f( x) 的三倍吗 ?
Activity 2: Predicting the Effects of Transformations
::活动2:预测转型的影响T he general form of a logarithmic function is where and are real numbers. The variable is a positive number not equal to 1, and
::对数函数的一般形式是 f( x) = alogb{( x- h)+k, 其中 a、 b、 k 和 h 是真实数字。 变量b 是正数, 不等于 1, x- h> 0。 与其他函数一样, 该函数的值是垂直缩放函数的值, h 的值水平移动函数, k 的值垂直移动函数 。
::示例示例示例示例
::对数函数被转换成等式 : f( x) = 4+3log( x- 5) 。 这个图形如何从 f( x) = logx 转换? 提醒注意, 如果您看不到基数, 基数是 10 。Since the graph will have a vertical translation 4 units up. With the graph will have a vertical scaling factor of 3. Lastly, with the graph will be translated 5 units to the right. You can compare the original graph (checkered line) with the translated graph (solid line) to see these changes.
::k=4 后, 图形将有一个垂直翻译 4 个单位向上。 使用 a=3 , 图形将有一个垂直缩放因子 3 。 最后, h=5 , 图形将把 5 个单位向右翻译。 您可以将原始图形( 检查行) 与 翻译的图形( 固体线) 进行比较, 查看这些变化 。Answer:
::答复:Use the interactive below to explore the effects of transformations on logarithmic functions visually.
::使用下面的交互功能来探索对数函数变换对视效果的影响。
Activity 3: Graphing Logarithmic Functions Using Transformations
::活动3:利用变形绘制对数函数图The table below summarizes how the graph of is transformed as the equation changes.
::下表概述了f(x)=log2x的图形如何随着方程式变化而变化。Equation Relationship to Domain for
::h> 0 的 g( x) =log2 @ @ (x- h) =log2 @ (x- h)Obtain a graph of by shifting the graph of units to the right. for Obtain a graph of by shifting the graph of units to the left. for Obtain a graph of by shifting the graph of up units. for Obtain a graph of by shifting the graph of down units. for Obtain a graph of by vertically stretching the graph of by a factor of for Obtain a graph of by vertically stretching the graph of by a factor of and by reflection the graph of the axis. Obtain a graph of by reflection the graph of f(x) over the axis.
Example
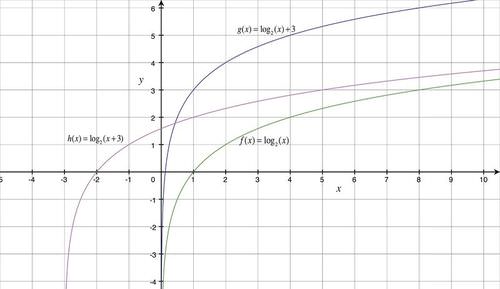
::示例示例示例示例Graph the following functions: and How does the location of the 3 in the last two equations impact the graph?
::如下函数图解 : f( x) = log2 ( x), g( x) = log2 ( x)+3, h( x) = log2 ( x) +3) 和 h( x) = log2 ( x+3) 。 后两个方程式中 3 的位置如何影响图形 ?The graph below shows these three functions together:
::下图显示了这三种功能的组合:Answer:
::答复:T he location of the 3 in the equation makes a difference. When the 3 is added to there is a vertical shift 3 units up. When the 3 is added to the , there is a horizontal shift 3 units to the left. Remember that adding 3 to the is a horizontal shift to the left. S ubtracting 3 from the would have shifted the graph horizontally to the right. To help make sense of this transformation, consider the function value when :
::方程中 3 的位置不同。 当将 3 添加到 log2 \ x 时, 向上有一个垂直移动 3 单位。 当 3 添加到 x 时, 向左有一个水平移动 3 单位。 记住, 在 x 中增加 3 是向左水平移动 。 从 x 中减去 3 时, 平面图会水平向右移动 。 为了帮助理解这种转换, 当 x \ 3 时考虑函数值 :
::h (3) = log2 (3+3) = log2 0 = 未定义This value is the vertical asymptote. It is also important to note that the log functions above are all graphed using the transformations knowing that has an intercept of (1, 0). If you wanted to know a particular value for a specific value, you would need to solve the logarithmic equation.
::这个值是垂直的零点。 还必须注意的是, 上面的日志函数都是使用这些转换来绘制图表的, 因为知道 f( x) =log2( x) 有 x 的 X 拦截值 ( 1, 0) 。 如果您想知道一个特定的 x 值的 y 值, 您需要解析对数方程式 。
Extension: The E ffects of Transformations on Inverse Functions
::扩展:转型对反向函数的影响Use the interactive below to examine how transformations affect the inverse of the logarithms graphed.
::使用下面的交互效果来检查变换如何影响图表对数的反向。Discussion Questions :
::讨论问题:-
What is the equation for its inverse, logarithmic function?
::其反对数函数的方程是什么? -
What is the effect on both the exponential graph as
becomes smaller/larger? Given this, what do you predict will happen to the inverse logarithmic equation and graph? Why?
::k 变小/ 变大对数方程和图对两个指数图形的影响是什么? 有鉴于此, 您预测反对数方程和图会发生什么? 为什么? -
What is the effect on both the exponential graph as
becomes smaller/larger? Given this, what do you predict will happen to the inverse logarithmic equation and graph? Why?
::当 h 变小/ 变大时, 对两个指数图形的影响是什么 ? 有鉴于此, 您预测反对数方程和图会发生什么 ? 为什么 ?
Wrap-Up: Review Question s
::总结:审查问题Use the videos below to review the concepts covered in this section:
::使用以下录像来审查本节所包括的概念:Summary
::摘要The transformed logarithmic function can be written as where are real numbers:
::转换的对数函数可以写成 f( x) = alogb {( x- h)+k, 其中 a、 b、 k 和 h 是实际数字 :-
shifts the graph horizontally
::h 水平移动图形 -
shifts the graph vertically
::k k 垂直移动图形 -
vertically stretches the graph
::a 垂直伸展图 -
flips the graph over the x-axis and vertically stretches the graph
::- 将图形翻转到 X 轴上,垂直拉伸图 -
reflects the graph over the y-axis
::-x 反映 Y 轴上的图形
-
Locate and identify the domain
,
range, and intercepts of a logarithmic function.