7.2 面积和范围-interactive
章节大纲
-
What are Domain and Range?
::什么是域和范围?Domain and range are important values that help to define a relation . The domain is the set of input values. These values are represented by the independent variable and are graphed on the axis of a coordinate graph . The range is the set of output values for a function . These values represent the dependent variable and are the axis value. Domain and range can either be determined by a mathematical rule or by the data in the function.
::域和范围是有助于定义关系的重要值。域是输入值的一组。这些值由独立的变量代表,以坐标图形的x轴为图表。区域是函数的一组输出值。这些值代表附属变量,是 y 轴值。域和范围可以由数学规则或函数中的数据确定。In computer programming, a boolean is a binary ('bi' meaning 'two') data type that can take the form of either a 1 or a 0. This data type is often used as a variable to represent either true or false. Typically the number 0 is used to represent false, and the number 1 is used to represent true. You are writing a function which will allow the user to input any whole number from 2 to 10 and the program will tell the user whether it is prime or composite. The number 0 will represent prime, and the number 1 will represent composite.
::在计算机编程中,布尔是一个二进制数据类型(“Bi”是指“2”),可以以 1 或 0 的形式出现。该数据类型通常用作变量,以代表真实或虚假。通常数字0用来代表虚假,数字1用来代表真实。您正在写一个函数,允许用户输入任何从2到10的整数,程序将告诉用户它是主数还是复合数。数字0将代表原始数,数字1将代表复合数。What is the domain of the function? What is the range?
::函数的域是什么? 范围是什么 ?Discussion Questions
::讨论问题 讨论问题-
What values can the user enter?
::用户可以输入什么值 ? -
What potential outcomes can the user receive?
::用户能够收到哪些潜在结果? -
Why isn’t 0 or 1 in the domain?
::为什么0或1不在域内? -
Why isn’t 2 in the range?
::为何2人不在射程之内?
Graphing a Function
::构造函数A mathematical function with numerical inputs and outputs can be displayed on a coordinate plane as you saw in the previous section. To graph a function, you plot the coordinates in the format with the coordinate representing the input value from the domain and the coordinate representing the corresponding output value from the range. The process for graphing functions is nearly identical to the process you would use when graphing linear relationships. You may review the lesson to explore this further.
::带有数字输入和输出的数学函数可以在坐标平面上显示,正如您在上一节中所看到的那样。要绘制一个函数,您可以用 x 坐标绘制(x,y) 格式的坐标,以x 坐标表示域内的输入值,y 坐标表示区域中的相应输出值。图形化函数的程序与绘制线性关系时使用的程序几乎相同。您可以查看该课程来进一步探讨这一点。Example
::示例示例示例示例Graph the function displayed in the table below:
::下表显示的函数图解 :
::投入产出1425334053To graph this function you will need to graph the points displayed in the table:
::要图形显示此函数,您需要图形显示表格中显示的点 :Use the interactive below to graph the following mapping of a function:
::使用下面的交互效果绘制函数映射图如下:INTERACTIVEGraphing a FunctionMove the points from the origin into the corresponding areas written in the chart below:
::将原点移到下图所写的相应区域:

+Do you want to reset the PLIX?Discussion Question
::讨论问题What challenges do you think graphing a mapping image can present that a table does not present?
::你认为绘制地图图像的图象会有什么挑战 显示表格没有出现?
Identifying Domain and Range
::确定域域和范围When identifying the domain and range in a function, you must remember that the domain is the set of input values and the range is the set of output values. E xamine what the domain and range look like in various forms:
::当确定函数中的域和范围时,您必须记住,域是输入值的一组,范围是输出值的一组。请检查域和范围以各种形式表现为何种类型:-
Set of Ordered Pairs
::一套有秩序对等
The domain of the function can be determined by listing all of the coordinates as a set. The range of the function can be determined by listing all of the coordinates as a set. Typically you write the numbers from least to greatest, and if a number repeats you only need to write it once.
::函数的域可以通过将所有 X 坐标都列成一组来确定。函数的范围可以通过将所有 Y 坐标都列成一组来确定。通常您从最小到最大写数字,如果数字重复,您只需要写一次。Domain = {1, 2, 3, 4, 5}
::域 = {1, 2, 3, 4, 5}Range = {0, 3, 8, 9}
::范围 = {0, 3, 8, 9}-
Table
::表格表表表表
::投入产出-351167-4100156The domain of the function can be determined from a table by listing all of the values in the column representing the x-coordinates. The range of the function can be determined from a table by listing all of the values in the column representing the y-coordinates.
::函数的域可以从表格中确定,方法是在代表 x 坐标的列中列出所有值。函数的范围可以从表格中列出代表 Y 坐标的列中的所有值。Domain = {-3, 1, 7, 10, 15}
::域 = {3, 1, 7, 10, 15}Range = {-4, 0, 5, 6, 16}
::范围 = {4,0,5,5,6,6,16}-
A Mapping Diagram
::A 绘图图图图
The domain of the function can be determined from a mapping diagram by listing all of the values in the column representing the input values. The range of the function can be determined from a mapping diagram by listing all of the values in the column representing the output values.
::函数的域可以从映射图中确定,方法是在代表输入值的列中列出所有值。函数的范围可以从映射图中确定,方法是在代表输出值的列中列出所有值。Domain = {0, 4, 7, 8, 10}
::域 = {0, 4, 7, 8, 8, 10}Range = {1, 3, 5}
::范围 = {1, 3, 5}-
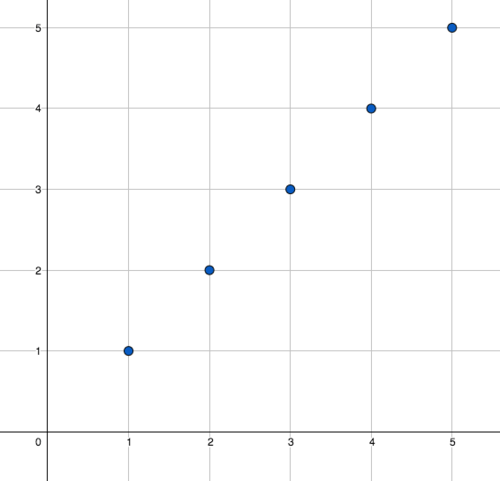
A Graph
::图图图
The domain of the function can be determined from a graph by listing all of the coordinates for the points.
::函数的域可以通过列出各点的所有坐标,从图表中确定。The range of the function can be determined from a graph by listing all of the coordinates for the points.
::函数的范围可以通过列出各个点的所有 Y 坐标,从图表中确定。Domain = {1, 2, 3, 4, 5}
::域 = {1, 2, 3, 4, 5}Range = {1, 2, 3, 4, 5}
::范围 = {1, 2, 3, 4, 5}Use the interactive below to practice finding the domain and range of a graphed function.
::使用下面的交互功能来练习查找图表化函数的域和范围。INTERACTIVEChoose the Bounds-
Input the domain and range of the points.
::输入各个点的域和范围。 -
Use commas in between each value.
::每个值之间使用逗号 。
+Do you want to reset the PLIX?
Identifying Domain and Range Continued
::确定域域和范围 继续It is possible for the domain and range not to be given directly but instead be inferred through the context of the function. When this is the case, the domain is the set of possible input values, and the range is the set of possible of output values.
::不直接给出域和范围是可能的,而是通过函数的上下文来推断。如果是这样,则域是一组可能的输入值,范围是一组可能的输出值。Answer the questions below to match the domain and range with the appropriate functions.
::回答下列问题,使域域和范围与适当职能相匹配。Summary
::摘要-
The domain is the set of input values.
::域是一组输入值。 -
The domain is represented by the independent variable and
is
graphed on the x-axis of a coordinate graph.
::域由独立的变量表示,以坐标图的 X 轴绘制。 -
The range is the set of output values.
::区域是一组输出值。 -
The range is represented by the dependent variable, and is graphed on the y-axis of a coordinate graph.
::区域由依附变量表示,以坐标图的 Y 轴为图表。
-
What values can the user enter?