7.5 表、图表和等式中的功能-interactive
章节大纲
-
Discrete and Continuous Functions
::分立和连续函数In the chapter Patterns and Associations in Data , functions were graphed as separate points using scatter plots. However, in the chapter Linear Relationships , the points were connected by a straight line. Connecting the points on a graph represents the difference between a discrete and continuous function . A discrete function is a function with a finite number of distinct input values. This type of function is made up of individual points. A continuous function has a domain that includes every possible value within a finite or infinite interval.
::在“数据模式和关联”的章节中,函数是用散点图解用散点绘制的。然而,在“线性关系”的章节中,各点是用直线连接的。连接图形上的点代表离散函数和连续函数之间的差别。离散函数是带有一定数量不同输入值的函数。这种类型的函数由单个点组成。连续函数有一个域,包括一个有限或无限间隔内的所有可能值。Example
::示例示例示例示例Tom is driving in his car at the constant speed of 30 miles per hour. Would a function that shows the distance of the car in miles after x hours be discrete or continuous?
::汤姆驾驶汽车时速为每小时30英里。 显示汽车在x小时后数英里距离的函数是离散的还是连续的?This is an example of a continuous function because we can input any time. For example, you can input 4.1345 seconds in for the time and get an output value of 70.2865 miles.
::这是一个持续函数的示例, 因为我们可以随时输入。 例如, 您可以输入4. 1345 秒的时间, 并获得70 2865英里的输出值 。Example
::示例示例示例示例A computer programmer is writing a function which will allow the user to input any whole number from 2 to 10 and the program will tell the user whether it is prime or composite. The number 0 will be output if the number is prime, and the number 1 will be used for composite. Would this function be discrete or continuous?
::计算机程序员正在写入一个函数,让用户输入从 2 到 10 的任何整数, 程序会告诉用户它是正数还是复合数。 如果数字是正数, 数字0将是输出, 而数字1将被用于复合数。 这个函数是离散的还是连续的 ?This is an example of a discrete function because you can only put in specific values. Your function will not be able to return an output for 4.1345 because even though it is between 2 and 10, it is not a whole number.
::这是一个离散函数的示例, 因为您只能输入特定的值。 您的函数将无法返回4. 1345 的输出, 因为即使它介于 2 和 10 之间, 它也不是一个完整的数字 。
Graphing Equations
::图形平方In order to graph a function from an equation , it may be simplest to start by making an input/output table and then plotting the points on a graph. This strategy will work for any function.
::要用方程式绘制函数图, 最简单的起点可能是输入/ 输出表格, 然后在图形上绘制点。 此策略将适用于任何函数 。Example
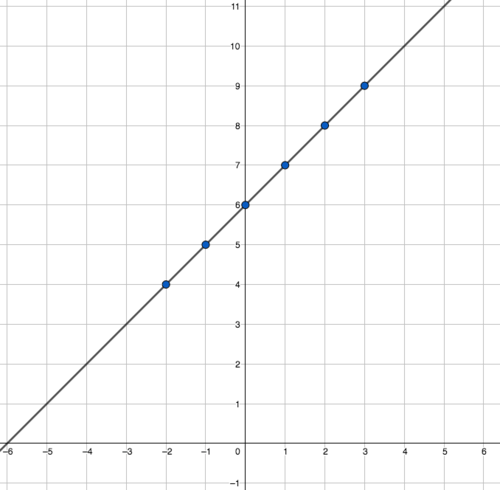
::示例示例示例示例Graph the continuous function f ( x ) = x + 6.
::图解连续函数 f( x) =x+6 。B egin by making a table of inputs and outputs.
::首先是编制一个投入和产出表。This will produce the following graph:
::这将产生下图:The dots can be connected because the equation applies to all real number inputs. This function will be a straight line, but that will not always be the case. As you go farther into algebra, you will become familiar with other types of functions.
::点可以连接, 因为方程式适用于所有实际数字输入。 此函数将是一个直线, 但并不总是这样。 当您进一步进入代数时, 您将会熟悉其他类型的函数 。
Interpreting Graphs
::解释图表The lesson used to write the equation of a function , where x represents the input and f ( x ) represents the output. For example, the statement f ( 4 ) = 17 represents the coordinate (4, 17) with 4 representing the input and 17 representing the output.
::用于写入函数方程式的课程,其中 x 表示输入, f(x) 表示输出。例如, 语句 f(4)=17 表示坐标(4, 17), 4 表示输入, 17 表示输出。Tracking an object's position, velocity, and acceleration over time is an important responsibility for physicists who study the movement of objects. Physicists use computer programs and sensors to generate graphs which they can use to observe the movement of an object over time. These graphs are used to study the motion of planetary bodies, to analyze car impacts, to program robotic movements, and much more.
::跟踪物体的位置、速度和时间加速是研究物体移动的物理学家的一项重要责任。物理学家使用计算机程序和传感器生成图表,以便他们能够用来观察物体随时间移动的动向。这些图表用来研究行星体的运动、分析汽车撞击、编程机器人运动等等。The first graph you will look at is called a position vs. time graph. This type of graph displays time along the x - axis and displays the distance traveled by the object along the y - axis. The position is displayed as a function of time. These functions are examples of continuous functions because you can find the position of an object relative to its starting point at any time over the interval from start to stop.
::您要查看的第一个图形被称为位置对时间图。 这种类型的图形显示 x 轴的时段, 并显示对象在 y 轴上行走的距离。 位置显示为时间函数。 这些函数是连续函数的示例, 因为您可以在从开始到停止的间隔的任何时候找到一个对象相对于其起始点的位置 。Use the interactive below to explore two sample distance vs. time graphs.
::使用下面的交互数据来探索两个样本距离相对于时间图。Discussion Questions
::讨论问题 讨论问题-
For which value(s) of x does f(x) = 0?
::F(x) = 0 的 x 值是多少? -
For which value(s) does g(x) = 0?
::g(x) = 0 的值是多少? -
How do you think a distance can be negative?
::你觉得距离怎么会是负的?
Time vs Distance is a function because for each moment in time, an object can only be in one position. What would it mean in the context of the problem if for one input, the graph had two outputs?
::时间对距离是一个函数,因为每个时刻,一个对象只能处于一个位置。在问题的背景中,如果对一个输入来说,图形有两个输出,它意味着什么?
Matching Graphs to Equations
::匹配图形到方形One method for checking whether the correct graph is used to model a function equation is to check specific inputs and outputs. Choose points from the graph, put the x-value into the equation and see if you get the same output value as shown on the graph.
::检查是否使用正确的图形来模拟函数方程式的方法之一是检查具体的输入和输出。从图形中选择点,将 x 值放入方程式,并查看您是否得到与图形中显示的相同输出值。Use the interactive below to match the function equation with the graph.
::使用下面的交互式方程式将函数方程式与图形匹配。Summary -
A discrete function is a function with a finite number of distinct input values. Seen as individual points.
::离散函数是带有数量有限的不同输入值的函数。 -
A continuous function has a domain that includes every possible value within a finite or infinite interval.
::连续函数有一个域,包括在一定间隔内或无限间隔内的所有可能值。 -
To graph a linear function, find input and output values and plot the points and draw a line through them.
::要绘制线性函数图,请查找输入值和输出值,绘制点,并通过它们绘制一条线条。
-
For which value(s) of x does f(x) = 0?