12.12线性函数图
Section outline
-
It is Reggie’s first day on the job at The Taco Shop near his house. Reggie is looking over the menu when he notices that the restaurant now offers family or group combo orders of 12 tacos. If a customer orders 1 combo, he will get 12 tacos. If the customer orders 2 combos, he will get 24 tacos. Because his math class recently studied functions, Reggie realizes the number of tacos is a function of the number of combos ordered, as demonstrated below.
::这是Reggie在家附近的Taco商店工作的第一天。 Reggie注意到餐馆现在提供12种玉米卷的家庭或集体组合订单时正在查看菜单。 如果客户订购1套组合,他将得到12套玉米卷。 如果客户订购2套组合,他将得到24套玉米卷。 由于他最近学习的数学课功能,Reggie意识到玉米卷的数量取决于订购的玉米卷数量,如下文所示。Combos Tacos 1 12 2 24 3 36 4 48 5 60 How can this data can be displayed visually with a graph?
::如何用图表用视觉显示这些数据?In this concept, you will learn how to graph .
::在这一概念中,你会学会如何绘制图表。Graphing Linear Functions
::直线函数A function is a set of data that has a specific relationship. One variable in the data set is related to or depends on a different variable in the same data set. Each input matches with only one output.
::函数是一组具有特定关系的数据集。数据集中有一个变量与同一数据集中不同的变量相关,或取决于不同的变量。每个输入与只有一个输出匹配。This is why graphing functions is important. A graph of a function can show the relationship between the value and the value.
::这就是为什么图形化函数很重要的原因。一个函数的图形可以显示 x 值和 y 值之间的关系。Take a look at the following table.
::请看下表。0 2 1 4 2 6 3 8 In this table, the letters and are used instead of input and output. They mean the same thing, but in mathematics as you work with functions, you will use and more often.
::在此表格中, 字母 x 和 y 被使用, 而不是输入和输出。 它们的意思是一样的, 但是在数学中, 当您使用函数时, 您会更经常地使用 x 和 y 。Here, is the input value and is the output value. The value depends on the value. You can see that each value of the column matches with only one value of the column. This means that this table forms a function.
::这里, x 是输入值, y 是输出值。 y 值取决于 x 值。 您可以看到 x 列的每个值与 Y 列只有一个值匹配。 这意味着此表格形成函数 。Here is another table.
::这是另一张桌子。1 5 1 7 3 9 4 13 In this table, the value of 1 is connected to two different “ ” values (5 and 7) at the same time. This is NOT a function. Remember, to be a function each value of the column can match with only ONE value of the column.
::在此表格中, 1 的 x 值同时连接到两个不同的“ y” 值( 5 和 7 ) 。 这不是一个函数。 记住, 要成为 x 列的每个值只能匹配 y 列的 1 值 。Let’s look at functions in a real life situation.
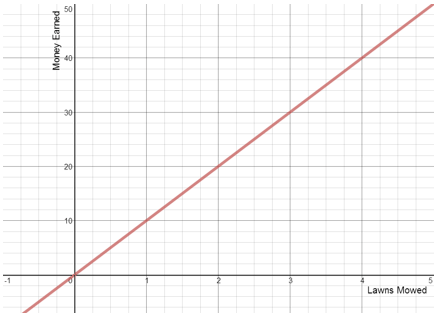
::让我们看看现实生活中的功能。Felix has a job cutting grass in the summer time. He earns $10.00 per lawn that he cuts. The amount of money that Felix makes is related to the number of lawns that he cuts. Let’s look at some data about Felix and then show how this forms a function.
::菲利克斯在夏季有一份切草的工作。 他每切草坪挣10.00美元。 费利克斯赚的钱与他切草坪的数量有关。 让我们看看关于菲利克斯的一些数据,然后展示这如何形成功能。Felix cut the following lawns on four different days.
::菲利克斯在四天内切下以下草坪Day 1 = 1 lawn = $10.00
::第1天 = 1 草坪 = $0.00Day 2 = 2 lawns = $20.00
::第2天 = 2 草坪 = 20 000美元Day 3 = 3 lawns = $30.00
::第3天=3个草坪=3美元Day 4 = 4 lawns = $40.00
::第4天=4个草坪=4个草坪=4 000美元This data can be organized in a table with the number of lawns represented by the value and the amount of money earned represented by the value. The is the value that can be counted on or depended on and the value changes depending on the value.
::该数据可按表格排列,表格中以x值表示的草坪数和y值表示的挣得金额。x是可以计算或依赖的值,y值的变化取决于x值。This is represented in the following table.
::如下表所示。1 $10 2 $20 3 $30 4 $40 You can say that the amount of money that Felix earns is a function of the number of lawns that he mows.
::你可以说,费利克斯挣得的钱量 取决于他修剪的草坪数量。You can also graph functions on the coordinate grid by using the values in each column to form ordered pairs.
::您也可以使用每列中的值来组成有顺序的配对,以此在坐标网格上图形化函数。Notice that in an ordered pair you have an value and a y value. Let’s write this data as ordered pairs.
::请注意,在一对定购的配对中,您有一个 x 值和一个 y 值。让我们以定购的配对形式写入此数据 。(1, 10)
(2, 20)
(3, 30)
(4, 40)
Now you can graph the data.
::现在你可以绘制数据图了。Create a graph by plotting the values (the number of lawns mowed) on the axis and the values (the amount of money earned) on the axis.
::通过在 x 轴上绘制 x 值( 修剪的草坪数) 和在 y 轴上绘制 y 值( 挣得的钱数) 来创建图形 。This graph forms a linear function . Anytime a graph forms a line like this, it is called a graph of a linear function. If the line rises from left to right, the graph of the function increases. If the line slopes downward from left to right, the graph of the linear function decreases.
::此图形形成线性函数。 每当图形形成类似线性函数的线性函数, 它就被称为线性函数的图。 如果线性函数从左向右上升, 函数的图则会增加。 如果线性函数的线性斜坡从左向右下降, 线性函数的图则会减少 。Examples
::实例Example 1
::例1Earlier, you were given a problem about Reggie and his first day at The Taco Shop.
::早些时候,你得到一个问题 雷吉和他的第一天 在塔科商店。A customer walks up to the counter and asks Reggie how many tacos come in the family combo. Reggie tells the customer that each combo contains 12 tacos. The customer tells Reggie that he needs to order enough tacos for 11 people. He tells Reggie that 5 tacos should be enough for each person, which means he needs to get at least 55 tacos. Reggie does the math in his head and figures out that 5 combo packs will be 60 tacos because the number of tacos is a function of the number of combos the man orders. Reggie walks over to the kitchen and tells the cooks to get busy.
::一位顾客走到柜台,问Reggie家里有多少玉米卷。Reggie告诉顾客每套玉米卷都含有12个玉米卷。该顾客告诉Reggie他需要为11人订购足够的玉米卷。他告诉Reggie说,每人应该有足够的5个玉米卷,这意味着他需要至少得到55个玉米卷。Reggie做了他的数学计算,并发现5套玉米卷将是60个玉米卷,因为玉米卷的数量取决于男人订购的玉米卷的数量。Reggie走到厨房,告诉厨师们要忙起来。The following chart represents this function.
::下图显示此函数。Combos Tacos 1 12 2 24 3 36 4 48 5 60 How can Reggie display this function and data on a graph?
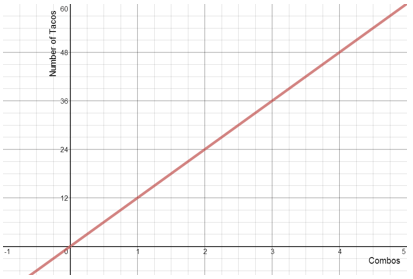
::Reggie如何在图表中显示此函数和数据 ?To graph this linear function, first identify the ordered pairs.
::要绘制此线性函数图, 请首先识别有顺序的对子 。(1, 12) (2, 24) (3, 36), (4, 48) (5, 60)
Next, plot those five points on the coordinate plane by locating the -coordinate then going up or down to the -coordinate. Then connect them as shown below.
::接下来,在坐标平面上绘制这五个点, 定位 x - 坐标然后向上或向下到 y - 坐标。 然后将其连接如下 。Here is a graph representing the data from the table.
::这是一张图表, 显示表格中的数据 。Notice that this is a linear graph showing the relationship between number of combo packs and the number of tacos.
::请注意, 这是一个线性图表, 显示组合包数和玉米饼数之间的关系 。Example 2
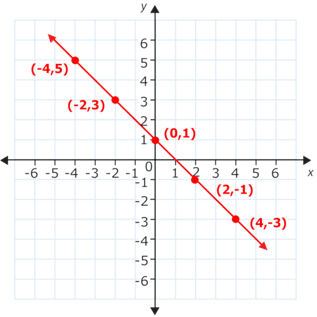
::例2On a coordinate plane, graph the linear function that is represented by the ordered pairs in the table below.
::在坐标平面上,图示下表中定购对子所代表的线性函数。-4 5 -2 3 0 1 2 -1 4 -3 First, identify the ordered pairs by pairing the value with its value.
::首先,通过将 x 值与其 y 值配对,来识别定购的对。The ordered pairs shown in the table are (-4, 5), (-2, 3), (0, 1), (2, -1) and (4, -3).
::表中显示的定购配对是(4、4、5、2、3、0、1)、2、1和4、3)。Next, plot those five points on the coordinate plane by locating the -coordinate then going up or down to the -coordinate.
::接下来,在坐标平面上绘制这五个点, 定位 x - 坐标然后向上或向下到 y - 坐标 。Then connect them as shown below.
::然后将其连接如下所示。Notice that the graph of this function is a straight line that decreases from left to right. That is because this function is a linear function.
::注意此函数的图形是一条从左向右下降的直线。这是因为此函数是一个线性函数。Example 3
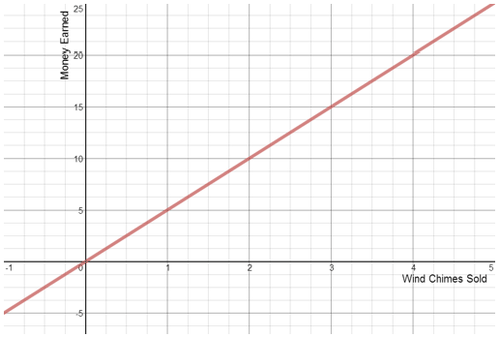
::例3Does this graph show an increase or a decrease?
::此图显示增减吗 ?First, look at the line representing this function. The line rises as it goes from left to right. Therefore , the function increases.
::首先,请看代表此函数的线条。 线条从左向右上升。 因此, 函数会增加 。The answer is the function increases.
::答案是功能增加。Example 4
::例4In the graph in Example 3, is the amount of money earned represented on the axis or the axis?
::在例3中的图表中,X轴或Y轴上的收入数额是多少?First, look at the graph. The money earned is in increments of $5 (5, 10, 15, 20, 25). This data is on the axis.
::首先,请看图表。赚得的钱加5美元(5,10,15,20,25)。这个数据在Y轴上。The answer is the axis.
::答案是 Y 轴。Example 5
::例5According to the graph in Example 3, what is the largest number of wind chimes sold?
::根据例3中的图表,售出的风铃数量最多是多少?First, locate “wind chimes sold” on the graph. It is represented on the axis.
::首先,在图中找到“出售的风铃”,在x轴上标出。Next, locate the largest -coordinate.
::下一个 定位最大的X坐标5
The answer is 5 wind chimes.
::答案是5个风铃Review
::回顾Graph each function represented by the data in the table then determine which represent linear graphs and which ones do not.
::图表中以数据表示的每个函数图,然后确定哪些表示线性图,哪些不表示线性图。Input Output 1 4 2 5 3 6 4 7 Input Output 2 4 3 6 4 8 5 10 Input Output 1 3 2 6 4 12 5 15 Input Output 9 7 7 5 5 3 3 1 Input Output 8 12 9 13 11 15 20 24 Input Output 3 21 4 28 6 42 8 56 Input Output 2 5 3 7 4 9 5 11 Input Output 4 7 5 9 6 11 8 15 Input Output 5 14 6 17 7 20 8 23 Input Output 4 16 5 20 6 24 8 32
Review (Answers)
::回顾(答复)