机器学习
样本误差 (Sample Error)
样本误差是指一个假设 h 在从数据分布 X 中抽取的样本 S 上错误分类的实例所占的比例。
定义: 假设 h 相对于目标函数 f 和数据样本 S 的样本误差 errors(h) 定义为:
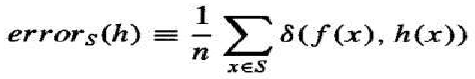
其中 n 是样本 S 中的实例数量,δ(f(x),h(x)) 如果 则为 1,否则为 0。
真实误差 (True Error)
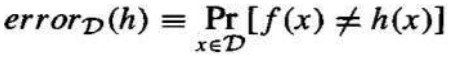
真实误差是指一个假设 h 错误分类从分布 D 中随机抽取的一个实例的概率。
定义: 假设 h 相对于目标函数 f 和分布 D 的真实误差 errorD(h),是 h 错误分类根据 D 随机抽取的一个实例的概率。
离散值假设的置信区间
假设我们希望基于假设 h 在样本 S 上观察到的样本误差来估计其真实误差 errorD(h),其中:
- 样本 S 包含 n 个根据概率分布 D 独立抽取的实例,且独立于 h。
- 。
- 假设 h 在这 n 个实例上犯了 r 个错误(即 )。
在这些条件下,统计学理论允许我们做出以下断言:
-
在没有其他信息的情况下,errorD(h) 最可能的值是 errors(h)。
-
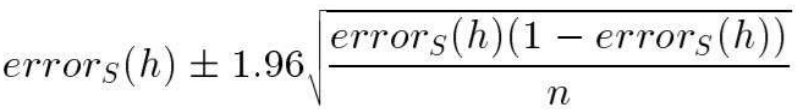
大约有 95% 的概率,真实误差 errorD(h) 落在以下区间内:

示例:
假设数据样本 S 包含 个实例,并且假设 h 在这些数据上犯了 个错误。
-
样本误差为 。
-
在没有其他信息的情况下,真实误差 ,即 。
-
errorD(h) 的 95% 置信区间估计为:

-
0.30±(1.96×400.30(1−0.30))
=0.30±(1.96×0.0724)
≈0.30±0.14
-
不同的常数 ZN 用于计算 N% 的置信区间。近似 N% 置信区间 errorD(h) 的通用表达式为:
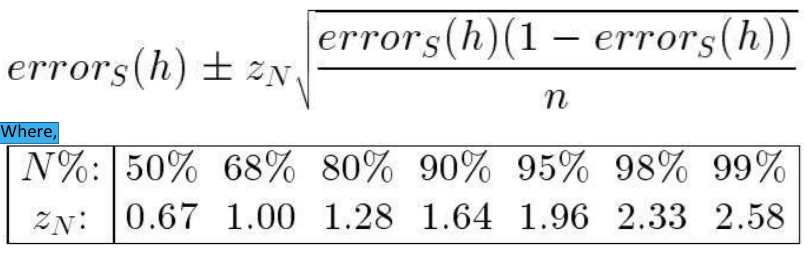
其中 ZN 是与置信水平 N 相关的标准正态分布分位数(例如,对于 95% 置信度,;对于 68% 置信度,)。
上述方程描述了如何计算基于 errors(h) 的 errorD(h) 估计值的置信区间,或误差棒。
示例:
假设数据样本 S 包含 个实例,并且假设 h 在这些数据上犯了 个错误。
-
样本误差为 。
-
errorD(h) 的 68% 置信区间估计为:
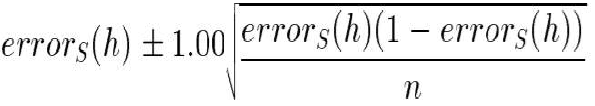
0.30±(1.00×400.30(1−0.30))
=0.30±(1.00×0.0724)
≈0.30±0.07
Sample Error –
The sample error of a hypothesis with respect to some sample S of instances drawn from X is the
fraction of S that it misclassifies.
Definition: The sample error (errors) of hypothesis h with respect to target function f and data
sample S is
Where n is the number of examples in S, and the quantity δ(f(x), h(x)) is 1 if f (x) ≠ h(x), and 0
otherwise.
True Error –
The true error of a hypothesis is the probability that it will misclassify a single randomly drawn
instance from the distribution D.
Definition: The true error (errorD ) of hypothesis h with respect to target function f and
distribution D, is the probability that h will misclassify an instance drawn at random according to D.
Confidence Intervals for Discrete-Valued Hypotheses
Suppose we wish to estimate the true error for some discrete valued hypothesis h, based on its
observed sample error over a sample S, where
The sample S contains n examples drawn independent of one another, and independent of h,
according to the probability distribution D
n ≥ 30
Hypothesis h commits r errors over these n examples (i.e., errors = r/n).
Under these conditions, statistical theory allows to make the following assertions:
1. Given no other information, the most probable value of errorD is errors
2. With approximately 95% probability, the true error errorD lies in the interval
Example:
Suppose the data sample S contains n = 40 examples and that hypothesis h commits r = 12 errors over
this data.
The sample error is errors = r/n = 12/40 = 0.30
Given no other information, true error is errorD = errors
, i.e., errorD
= 0.30
With the 95% confidence interval estimate for errorD .
= 0.30 ± (1.96 * 0.07)
= 0.30 ± 0.14
3. A different constant, ZN, is used to calculate the N% confidence interval. The general expression for
approximate N% confidence intervals for errorD is
Where,
The above equation describes how to calculate the confidence intervals, or error bars, for estimates of
errorD that are based on errors
Example:
Suppose the data sample S contains n = 40 examples and that hypothesis h commits r = 12 errors over
this data.
The sample error is errors = r/n = 12/40 = 0.30
With the 68% confidence interval estimate for errorD .
95
= 0.30 ± (1.00 * 0.07)
= 0.30 ± 0.07