Python 机器学习
聚类简介
聚类方法是最有用的无监督机器学习方法之一。这些方法用于发现数据样本之间的相似性和关系模式,然后根据特征将这些样本聚集成具有相似性的组。
聚类很重要,因为它确定了现有未标记数据之间的内在分组。它们基本上对数据点做了一些假设以构成它们的相似性。每个假设都会构建不同但同样有效的簇。
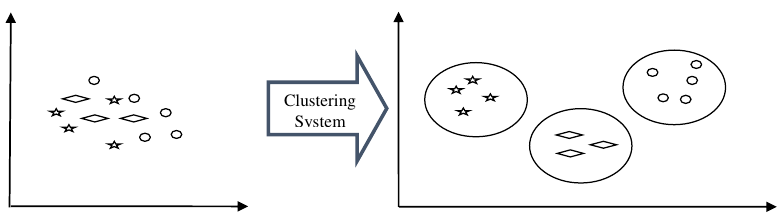
例如,下图显示了聚类系统将相似类型的数据分组到不同簇中:
簇形成方法 (Cluster Formation Methods)
簇不一定以球形形式形成。以下是一些其他簇形成方法:
基于密度 (Density-based)
在这些方法中,簇形成密集的区域。这些方法的优点是它们具有良好的准确性以及合并两个簇的良好能力。例如,基于密度的空间聚类应用与噪声 (DBSCAN)、识别聚类结构的排序点 (OPTICS) 等。
基于层次 (Hierarchical-based)
在这些方法中,簇根据层次形成树型结构。它们有两个类别,即凝聚式(自下而上方法)和分裂式(自上而下方法)。例如,使用代表的聚类 (CURE)、使用层次的平衡迭代归约聚类 (BIRCH) 等。
分割 (Partitioning)
在这些方法中,通过将对象划分为 k 个簇来形成簇。簇的数量将等于分区的数量。例如,K-均值、基于随机搜索的大型应用程序聚类 (CLARANS)。
网格 (Grid)
在这些方法中,簇形成网格状结构。这些方法的优点是所有在这些网格上进行的聚类操作都很快,并且独立于数据对象的数量。例如,统计信息网格 (STING)、Quest 中的聚类 (CLIQUE)。
衡量聚类性能 (Measuring Clustering Performance)
关于机器学习模型最重要的考虑之一是评估其性能,或者可以说模型的质量。在监督学习算法的情况下,评估我们模型的质量很容易,因为我们已经为每个示例提供了标签。
另一方面,在无监督学习算法的情况下,我们没有那么幸运,因为我们处理的是未标记的数据。但我们仍然有一些指标,可以根据算法为实践者提供有关簇变化发生情况的见解。
在我们深入研究这些指标之前,我们必须明白这些指标仅评估模型之间的比较性能,而不是衡量模型预测的有效性。以下是我们可以在聚类算法上部署的一些指标来衡量模型质量:
轮廓分析 (Silhouette Analysis)
轮廓分析用于通过测量簇之间的距离来检查聚类模型的质量。它基本上为我们提供了一种评估诸如簇数量之类的参数的方法,借助轮廓分数。这个分数衡量一个簇中的每个点与相邻簇中的点之间的距离。
轮廓分数的分析
轮廓分数的范围是 [-1, 1]。其分析如下:
- +1 分数:接近 +1 的轮廓分数表示样本远离其相邻簇。
- 0 分数:0 的轮廓分数表示样本位于或非常接近分隔两个相邻簇的决策边界。
- -1 分数:-1 的轮廓分数表示样本已被分配到错误的簇。
轮廓分数的计算可以使用以下公式完成:
![]()
其中,p = 到最近簇中点的平均距离
q = 到所有点的簇内平均距离。
戴维斯-布尔丁指数 (Davis-Bouldin Index)
DB 指数是另一种很好的指标,用于对聚类算法进行分析。借助 DB 指数,我们可以了解聚类模型的以下几点:
- 簇是否彼此间隔良好?
- 簇的密度如何?
我们可以借助以下公式计算 DB 指数:
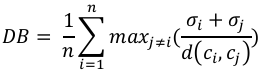
其中,n = 簇的数量
σi = 簇 i 中所有点到簇质心 ci 的平均距离。
DB 指数越小,聚类模型越好。
邓恩指数 (Dunn Index)
它与 DB 指数的工作方式相同,但两者在以下几点有所不同:
- 邓恩指数只考虑最坏情况,即彼此靠近的簇,而 DB 指数考虑聚类模型中所有簇的分散和分离。
- 邓恩指数随着性能的提高而增加,而 DB 指数在簇间隔良好且密集时表现更好。
我们可以借助以下公式计算邓恩指数:
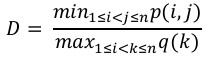
其中,i,j,k = 簇的每个索引
p = 簇间距离
q = 簇内距离
机器学习聚类算法的类型 (Types of ML Clustering Algorithms)
以下是最重要和最有用的机器学习聚类算法:
K-均值聚类 (K-means Clustering)
这种聚类算法计算质心并迭代,直到找到最优质心。它假设簇的数量是已知的。它也被称为扁平聚类算法。算法从数据中识别出的簇的数量用 K-均值中的“K”表示。
均值漂移算法 (Mean-Shift Algorithm)
它是无监督学习中另一种强大的聚类算法。与 K-均值聚类不同,它不进行任何假设,因此它是一种非参数算法。
层次聚类 (Hierarchical Clustering)
它是另一种无监督学习算法,用于将具有相似特征的未标记数据点分组在一起。
我们将在接下来的章节中详细讨论所有这些算法。
聚类的应用 (Applications of Clustering)
我们可以在以下领域发现聚类的用处:
- 数据汇总与压缩:聚类广泛用于需要数据汇总、压缩和缩减的领域。例如图像处理和向量量化。
- 协同系统和客户细分:由于聚类可用于查找相似产品或同类用户,因此它可用于协同系统和客户系统。
- 作为其他数据挖掘任务的关键中间步骤:聚类分析可以为分类、测试、假设生成生成紧凑的数据摘要;因此,它也作为其他数据挖掘任务的关键中间步骤。
- 动态数据中的趋势检测:聚类还可以通过创建各种相似趋势的簇来用于动态数据中的趋势检测。
- 社交网络分析:聚类可用于社交网络分析。例如,生成图像、视频或音频中的序列。
- 生物数据分析:聚类还可用于创建图像、视频的簇,因此它可以成功地用于生物数据分析。
17. Clustering Algorithms Machine
- Overview
Learning with Python
Introduction to Clustering
Clustering methods are one of the most useful unsupervised ML methods. These methods
are used to find similarity as well as the relationship patterns among data samples and
then cluster those samples into groups having similarity based on features.
Clustering is important because it determines the intrinsic grouping among the present
unlabeled data. They basically make some assumptions about data points to constitute
their similarity. Each assumption will construct different but equally valid clusters.
For example, below is the diagram which shows clustering system grouped together the
similar kind of data in different clusters:
Clustering
System
Cluster Formation Methods
It is not necessary that clusters will be formed in spherical form. Followings are some other
cluster formation methods:
Density-based
In these methods, the clusters are formed as the dense region. The advantage of these
methods is that they have good accuracy as well as good ability to merge two clusters.
Ex. Density-Based Spatial Clustering of Applications with Noise (DBSCAN), Ordering Points
to identify Clustering structure (OPTICS) etc.
Hierarchical-based
In these methods, the clusters are formed as a tree type structure based on the hierarchy.
They have two categories namely, Agglomerative (Bottom up approach) and Divisive (Top
down approach). Ex. Clustering using Representatives (CURE), Balanced iterative
Reducing Clustering using Hierarchies (BIRCH) etc.
Partitioning
111
Machine Learning with Python
In these methods, the clusters are formed by portioning the objects into k clusters.
Number of clusters will be equal to the number of partitions. Ex. K-means, Clustering Large
Applications based upon randomized Search (CLARANS).
Grid
In these methods, the clusters are formed as a grid like structure. The advantage of these
methods is that all the clustering operation done on these grids are fast and independent
of the number of data objects. Ex. Statistical Information Grid (STING), Clustering in Quest
(CLIQUE).
Measuring Clustering Performance
One of the most important consideration regarding ML model is assessing its performance
or you can say model’s quality. In case of supervised learning algorithms, assessing the
quality of our model is easy because we already have labels for every example.
On the other hand, in case of unsupervised learning algorithms we are not that much
blessed because we deal with unlabeled data. But still we have some metrics that give the
practitioner an insight about the happening of change in clusters depending on algorithm.
Before we deep dive into such metrics, we must understand that these metrics only
evaluates the comparative performance of models against each other rather than
measuring the validity of the model’s prediction. Followings are some of the metrics that
we can deploy on clustering algorithms to measure the quality of model:
Silhouette Analysis
Silhouette analysis used to check the quality of clustering model by measuring the distance
between the clusters. It basically provides us a way to assess the parameters like number
of clusters with the help of Silhouette score. This score measures how close each point
in one cluster is to points in the neighboring clusters.
Analysis of Silhouette Score
The range of Silhouette score is [-1, 1]. Its analysis is as follows:
+1 Score:- Near +1 Silhouette score indicates that the sample is far away from
its neighboring cluster.
0 Score:- 0 Silhouette score indicates that the sample is on or very close to the
decision boundary separating two neighboring clusters.
-1 Score: -1 Silhouette score indicates that the samples have been assigned to
the wrong clusters.
The calculation of Silhouette score can be done by using the following formula:
silhouette score = (p − q)/max(p, q)
Here, p = mean distance to the points in the nearest cluster
And, q = mean intra-cluster distance to all the points.
112
Machine Learning with Python
Davis-Bouldin Index
DB index is another good metric to perform the analysis of clustering algorithms. With the
help of DB index, we can understand the following points about clustering model:
Weather the clusters are well-spaced from each other or not?
How much dense the clusters are?
We can calculate DB index with the help of following formula:
n
1
σ i + σ j
DB = ∑ max j≠i (
)
n
d(ci , c j )
i=1
Here, n = number of clusters
σ i = average distance of all points in cluster i from the cluster centroid ci.
Less the DB index, better the clustering model is.
Dunn Index
It works same as DB index but there are following points in which both differs:
The Dunn index considers only the worst case i.e. the clusters that are close
together while DB index considers dispersion and separation of all the clusters in
clustering model.
Dunn index increases as the performance increases while DB index gets better
when clusters are well-spaced and dense.
We can calculate Dunn index with the help of following formula:
min 1≤i<j≤n p(i, j)
D=
max 1≤i<k≤nq(k)
Here, i, j, k = each indices for clusters
p = inter-cluster distance
q = intra-cluster distance
Types of ML Clustering Algorithms
The following are the most important and useful ML clustering algorithms:
K-means Clustering
This clustering algorithm computes the centroids and iterates until we it finds optimal
centroid. It assumes that the number of clusters are already known. It is also called flat
clustering algorithm. The number of clusters identified from data by algorithm is
represented by ‘K’ in K-means.
Mean-Shift Algorithm
It is another powerful clustering algorithm used in unsupervised learning. Unlike K-means
clustering, it does not make any assumptions hence it is a non-parametric algorithm.
113
Machine Learning with Python
Hierarchical Clustering
It is another unsupervised learning algorithm that is used to group together the unlabeled
data points having similar characteristics.
We will be discussing all these algorithms in detail in the upcoming chapters.
Applications of Clustering
We can find clustering useful in the following areas:
Data summarization and compression: Clustering is widely used in the areas where
we require data summarization, compression and reduction as well. The examples are
image processing and vector quantization.
Collaborative systems and customer segmentation: Since clustering can be used to
find similar products or same kind of users, it can be used in the area of collaborative
systems and customer segmentation.
Serve as a key intermediate step for other data mining tasks: Cluster analysis can
generate a compact summary of data for classification, testing, hypothesis generation;
hence, it serves as a key intermediate step for other data mining tasks also.
Trend detection in dynamic data: Clustering can also be used for trend detection in
dynamic data by making various clusters of similar trends.
Social network analysis: Clustering can be used in social network analysis. The
examples are generating sequences in images, videos or audios.
Biological data analysis: Clustering can also be used to make clusters of images, videos
hence it can successfully be used in biological data analysis.