使用点和斜坡绘制线形图
章节大纲
-
According to Hooke's Law, the force exerted on a spring, , is inversely proportional to the length of the spring that is compressed, : . The constant depends on whether the spring is stiff, a high constant , or loose, a low constant . Springs are behind how manometers or pressure gauges work. 1 We can graph this relation by using information about the , which we do in this section.
::根据胡克法则,弹簧所施加的力与弹簧的长度成反比,x:ykx。常数 k 取决于弹簧是硬的、高常数 k 或松散的、低常数 k。 弹簧是后方的压力计或压力计如何工作。 1 我们可以使用本节中我们所做的关于弹簧的信息来图出这一关系。
Graphing by the Point-Slope Method
::按点偏偏法绘制图In this section, we are going to use the idea of slope as rise over run to graph a line. Let's consider an example to see how this method works.Example 1
::例1Graph .
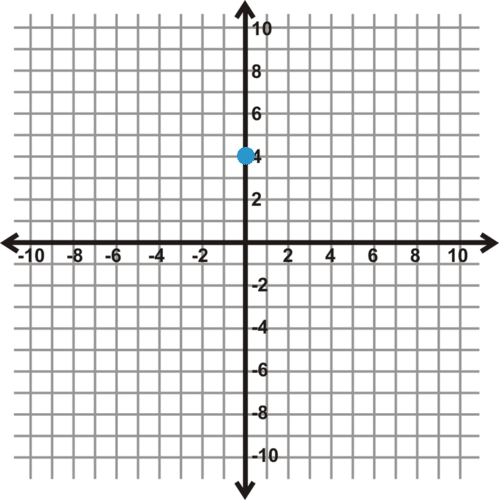
::图y=13x+4。Solution: First, we need to find a starting point to work from. Since this equation is in slope-intercept form , we can identify the y- intercept , which is (0, 4). This will be our starting point.
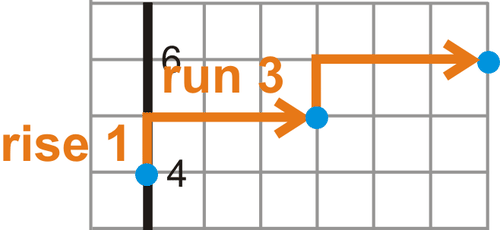
::解决方案 : 首先, 我们需要找到一个可以工作的起点 。 既然这个方程式是斜坡界面, 我们可以识别 y 界面, 也就是 0, 4 。 这将是我们的起点 。Next, we need to identify the rise and the run of the slope. Since the slope is , the rise is 1 unit and the run is 3 units. To find the next point we will plot on the graph, we go up 1 box because the rise is positive and to the right 3 boxes because the run is positive. Repeat this process again from the new point to get at least three points.
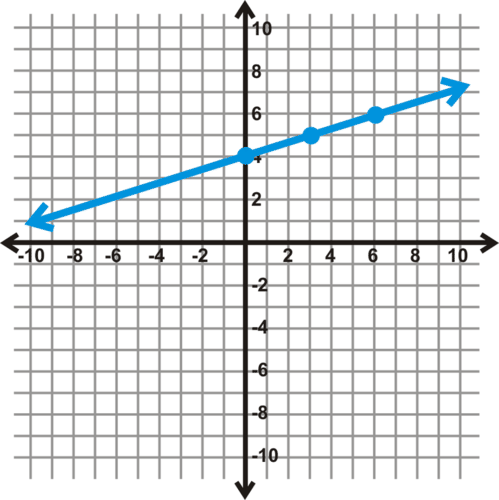
::接下来, 我们需要识别斜坡的上升和运行。 由于斜坡为13, 上升为1 个单位, 运行为 3 个单位。 要在图形上找到下一个点, 我们会在图形上绘制一个框, 因为上升为正数, 右3个框, 因为运行为正数 。 从新点再次重复此进程, 以获得至少3 个点 。Now that we have three points, connect them to form the line .
::现在,我们有三个点, 将它们连接成 y=13x+4 的线条 。Below, we list the steps for this process.
::下面我们列举这一进程的步骤。Graphing a Line With the Point-Slope Method
::使用点偏偏法绘制线条图1. Find a starting point to work from. If your equation is in slope-intercept form, identify the y- intercept. If your equation is in point-slope form, identify a point on the line. Plot the starting point.
::1. 寻找要工作的起点。如果您的方程式为斜坡界面,请标明 y 界面。如果您的方程式为点窗式,请标明线上的一个点。绘制起始点。2. I dentify the rise and the run of the slope. The rise will tell you how many boxes to go up or down. (Take care of the sign of the slope with the rise.) Go to the right the number of boxes in the run. From the starting point, follow the rise and run to find another point on the graph.
::2. 标明斜坡的升起和运行情况。 升起将告诉您要上下多少个框。 (注意斜坡的标志和上升。 ) 向右移运行中的框数。 从起点, 跟随上升并运行到图形上另找一个点 。3. Repeat this process again from the new point to get at least three points.
::3. 从新的角度再次重复这一进程,至少要达到三点。4. C onnect them to form the line.
::4. 将它们连接起来形成线条。Example 2
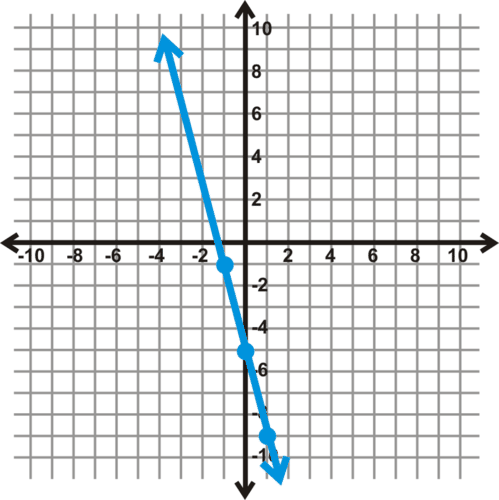
::例2The force exerted on the spring in the pressure gauge below can be modeled by . Graph this line.
Solution: Find the starting point on this line. Since it is in slope-intercept form, we identify the y- intercept, which is 0. The starting point is the origin.
::解决方案: 在这条线上找到起点。 由于它是斜坡界面, 我们确定 y 界面, 也就是 0。 起始点是源 。
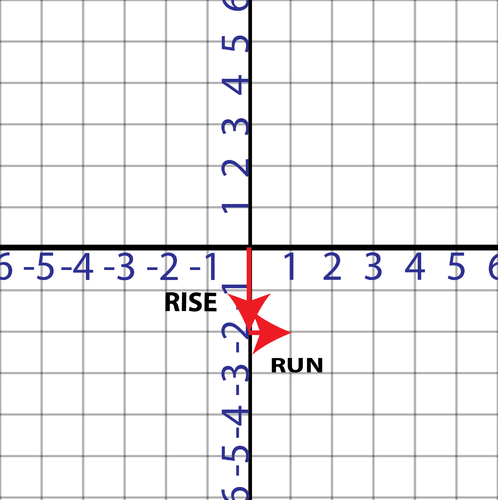
Next, we need to use the slope to find another point. The slope is -2 or , so we go down 2 boxes and to the right 1 box. Then, we repeat this process again to find a third point.
::接下来,我们需要用斜坡来找到另一个点。斜坡是 -2 或 2- 21, 所以我们往下走 2 个框, 往右走 1 个框。 然后, 我们重复这个过程, 找到第三个点 。Last, we graph the line.
::最后,我们绘制线条图。
by Mathispower4u demonstrates how to graph a line in slope-intercept form.
::由 Mathispower4u 演示如何用斜坡界面绘制线条图。Example 3
::例3Graph .
::图y - 1=32(x-2)Solution: First, we identify the starting point. Since this line is in point-slope form, we use the point on the line that we can recognize from the equation, which is (1,2). We plot (1,2) and then use the slope to go up 3 boxes from (1,2) and to the right 2 boxes. We repeat this process one more time to get three points. Then, we draw a line.
::解决方案 : 首先, 我们确定起始点 。 既然这条线是点倾斜式的, 我们使用一条线上的点, 我们从方程中可以识别到这个点, 也就是 1, 2 。 我们绘制一个线, 然后用斜坡从 1, 2 向上移动 3 个框, 然后从 1, 2 向右 2 个框。 我们再重复一次这个进程, 以获得 3 个点 。 然后, 我们绘制一条线 。
by Ginger Hampton demonstrates how to graph a line in point-slope form.
::金吉·汉普顿展示了如何用点斜形绘制线条图。Example 4
::例4Graph .
::图y+14(x+1)Solution: The starting point is (-1,-1). We then go down 4 boxes and to the right 1 box two times. This gives us three points and then we draw a line through them.
::解答: 起点是 (-1-1) 。 然后我们从 4 个盒子下到 右边 1 个盒子上 两次。 这给了我们3 个点, 然后我们通过它们画一条线 。Summary
::摘要-
Find a starting point to work from. Plot the starting point.
::寻找工作起点。 绘制起点 。
::寻找工作起点。 绘制起点 。 -
Then, i dentify the rise and the run of the slope. The rise will tell you how many boxes to move up or down. We move up for positive rises and down for negative rises. Next, move the number of boxes in the run. We move right for positive runs and left for negative runs. From the starting point, follow the rise and run to find another point on the graph.
::然后,请标明斜坡的上升和运行情况。 上升将告诉您要上下移动多少个框。 我们向上移动, 向上移动, 向下移动, 向下移动, 向下移动。 接下来, 移动运行中的框数。 我们向右移动, 向右移动, 向右移动, 向左移动, 向下运行。 从起点, 跟随上升, 并运行到图形上找到另一个点 。
::然后,请标明斜坡的上升和运行情况。 上升将告诉您要上下移动多少个框。 我们向上移动, 向上移动, 向下移动, 向下移动, 向下移动。 接下来, 移动运行中的框数。 我们向右移动, 向右移动, 向右移动, 向左移动, 向下运行。 从起点, 跟随上升, 并运行到图形上找到另一个点 。 -
Repeat this process again from the new point to get at least three points and connect them to form the line.
::从新点再次重复此进程, 以获得至少三个点, 并将其连接成线条 。
::从新点再次重复此进程, 以获得至少三个点, 并将其连接成线条 。
Review
::回顾Graph the following lines by identifying a point on the line and then using the slope.
::绘制下行图,标明线上的一个点,然后使用斜坡。1.
::1. y25x+72.
::2.y=12x-53.
::3. y*5x-24.
::4. y=32x+35.
::5. y16x-86.
::6. y+4=2(x+3)7.
::y- 54(x+2)8.
::8. y-612(x-1)9.
::9. y-334(x+3)10.
::y+4=23(x-2)Explore More
::探索更多1. In 1990, the average life expectancy in the United States was about 75 years. In 2005, the average life expectancy was about 77 years. 2 Find the slope and graph the line that models life expectancy in the U.S. (Hint: It may be helpful to change how much the boxes are worth, that is, instead of each box being worth 1 unit, define it as worth more than 1 unit).
::1. 1990年,美国的平均预期寿命约为75岁,2005年,平均预期寿命约为77岁。 2 找出斜坡并绘制线条,以模拟美国的预期寿命(提示:也许有必要改变箱值多少,即每个箱值1个单位,而不是每个箱值1个单位,将其定义为1个单位以上)。2. The local hiking club is finalizing its plans for a trip to the Rocky Mountains in Canada. The hikers are discussing the food they will have to carry with them to complete their climb up the mountains. The group decides on setting out with 84 pounds of food and figure they will eat 11 pounds each day. To make sure they will have enough food, the members of the club want to show how their food supply looks at the end of each day as well as at the end of their trip. Graph the line to show this.
::2. 当地登山俱乐部正在最后确定前往加拿大洛基山脉的行程计划,远足者们正在讨论他们为了完成登山而必须随身携带的食品,小组决定准备84磅食物,并估计他们每天将吃11磅食物,为了确保他们有足够的食物,俱乐部成员想展示他们的食品供应在每天的终点和旅程结束时的目光。3. At a football game, Brian is selling concessions. He sells soda for $2 a piece and popcorn for $3 per bag. At the end of the night, he has sold out of soda and has made a total of $264. Graph the line that models this situation. If he sold 60 sodas, how many bags of popcorn did he sell?
::3. 在一场足球比赛中,Brian在出售特许权,他卖苏打汽水,每块2美元,爆米花,每袋3美元;在晚上结束时,他卖光了苏打汽,总共赚了264美元。Answers to Review and Explore More Problems
::对审查和探讨更多问题的答复Please see the Appendix.
::请参看附录。References
::参考参考资料-
“Hooke’s Law,” last updated June 12, 2017,
.
::2017年6月12日更新。 -
“World Development Indicators - Google Public Domain Explorer,” data from World Bank, last updated April 27, 2017,
.
::“世界发展指标-谷歌公共域探索者”,来自世界银行的数据,最近于2017年4月27日更新。
-