线性不平等解决系统
章节大纲
-
It is recommended that cat food contain at least 25% protein and at most 50% fat for an adult cat 1 . If a can of cat food contains chicken that is 0.27 gram of protein and 0.14 gram of fat per gram of chicken and turkey that is 0.14 gram of protein and 0.06 gram of fat per gram of turkey, what combinations of chicken and turkey can be in a can of cat food to satisfy the recommendations? These requirements can be modeled by inequalities and we consider in this section.
::建议猫食至少含有25%的蛋白质,成年猫咪最多含有50%的脂肪。 如果猫食罐中含有鸡,其蛋白度为0.27克,每鸡和火鸡的脂肪为0.14克,蛋白度为0.14克,每鸡和火鸡的脂肪为0.06克,那么鸡和火鸡在猫食罐中可以有什么结合来满足建议?这些要求可以通过不平等来模拟,我们在本节中考虑。
Graphing a System of Linear Inequalities
::线性不平等体系图图Much like we did when graphing a system of equations , we can graph two linear equalities on one coordinate grid . In this section, we will follow the same process, but with linear inequalities instead of equations.
::与我们绘制方程式系统图时一样,我们可以在一个坐标网格上绘制两个线性等同。在本节,我们将遵循同样的进程,但线性不平等而不是方程式。Recall the steps for graphing a linear inequality .
::回顾线性不平等的图表绘制步骤。How to Graph a Linear Inequality
::如何绘制线性不平等分布图1. Treat the inequality like an equation and graph the boundary line . If the inequality is > or <, then the boundary line is dashed. If the inequality is or , then the boundary line is solid.
::1. 将不平等作为方程式处理,并绘制边界线图。如果不平等是 > 或 < ,那么边界线就会被冲破。如果不平等是 _ 或 _ ,那么边界线就会牢固。2. Pick a point on one side of the line to use as a test point. Substitute the values into the inequality and see if the inequality is true.
::2. 在线的一边选择一个点作为试验点,将价值作为不平等的替代,看看不平等是否真实。3. If the test point makes the inequality true, shade the side of the line that the test point is on. If the test point does not make the inequality true, shade the side that does not contain the test point.
::3. 如果试验点使不平等成为真实,试验点所在线的侧面要遮蔽,如果试验点不使不平等成为真实,试验点不包含试验点的侧面要遮蔽。Example 1
::例1Graph .
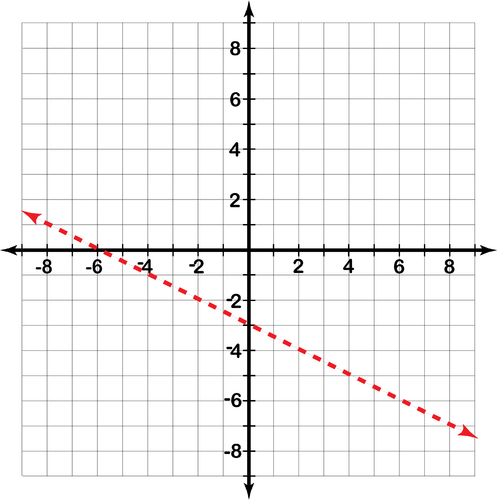
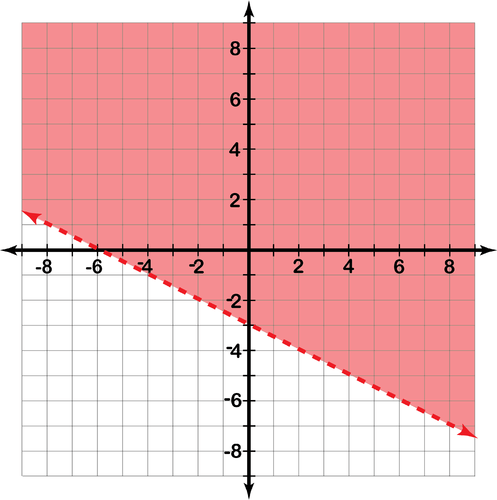
::图y12x-3。Solution: First, we consider the boundary line, . Since the symbol is a less than symbol, we will graph this line as a dashed line to indicate it is not included in the solution set .
::解答:首先,我们考虑边界线,y12x-3。 由于符号小于符号,我们将用虚线表示这条线,以表明它没有包括在成套的解决方案中。Next, we pick a text point on one side of the line to use. Let's use (1,1).
::接下来,我们在行的一边选择一个文本点。让我们使用(1,1 ) 。
Since (1,1) made the inequality true, we shade the side of the line that includes the test point.
::y12x-3112(1)-31212 由于(1,1)使不平等成为事实,我们在包括测试点的线的侧面阴影下。In this section, we will be graphing a system of inequalities—two or three linear inequalities on the same grid. The solution is the region of the graph that makes all of the inequalities true, that is, where the shaded regions overlap. If the shaded regions do not overlap, there is no solution.
::在本节中,我们将描绘一个不平等体系——同一网格上的两到三个线性不平等,解决办法是图中显示所有不平等都真实存在的区域,即阴影区域重叠的区域,如果阴影区域不重叠,就没有解决办法。Example 2
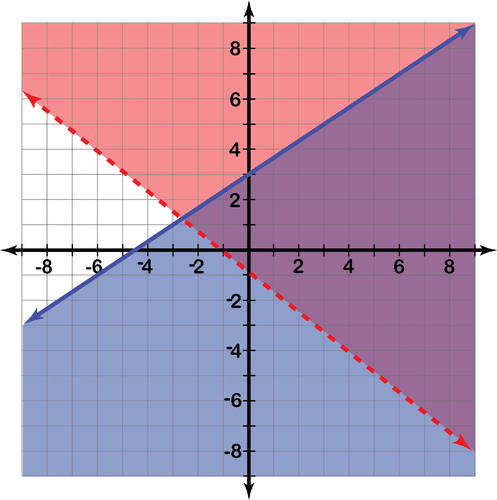
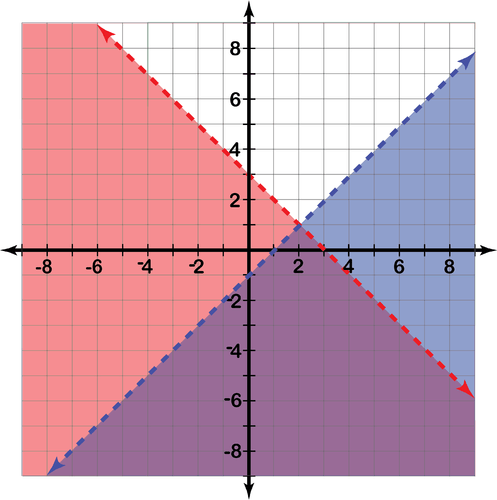
::例2Given the system of linear inequalities shown in the graph, determine which points are solutions to the system.
::鉴于图中显示的线性不平等制度,确定哪些点是这个制度的解决办法。a. (0, -1)
::a. a. (0, -1)b. (2, 3)
::b. b. (2,3)c. (-2, -1)
::c. (2-2-1)d. (3, 5)
::d. (3,5)Solution:
::解决方案 :a. The point (0, -1) is not a solution to the system of linear inequalities. It is a solution to (graphed in blue ), but it lies on the line which is not included in the solution to shown in red ). The point must satisfy both inequalities to be a solution to the system.
::a. 点(0,-1)不是线性不平等体系的解决方案,而是y23x+3(以蓝色标出)的解决方案,但在于y45x-1线上,该线上不包括在以红色标出的y45x-1的解决方案中。该点必须满足两种不平等,才能解决这一体系。b. The point (2, 3) lies in the overlapping shaded region and therefore is a solution to the system.
::b. 点(2,3)在于重叠的阴影区域,因此是系统的解决办法。c. The point (-2, -1) lies outside the overlapping shaded region and therefore is not a solution the system. It is a solution to (graphed in blue ).
::c. 点(2-2-1)位于重叠的阴影区域之外,因此不是系统的解决办法,是y23x+3(以蓝色标示)的解决办法。d. The point (3, 5) lies on the line , which is included in the solution to . Since this part of the line is included in the solution to , it is a solution to the system.
::d. 点(3,5)在y=23x+3号线上,该线包括在y23x+3的解决方案中。 由于该线的这一部分包括在y45x-1号的解决方案中,因此它是系统的一个解决方案。How to Graph a System of Inequalities
::如何构建不平等体系1. Graph the first inequality.
::1. 绘制第一种不平等情况图。2. Graph the second inequality on the same grid. Draw the shading in a different direction.
::2. 在同一网格上绘制第二个不平等图,将阴影划向不同的方向。3. The solution set is the region where the two shadings overlap.
::3. 确定的解决办法是两个阴影重叠的区域。Example 3
::例3Graph and identify the solution to the system:
::图形和确定系统解决方案:
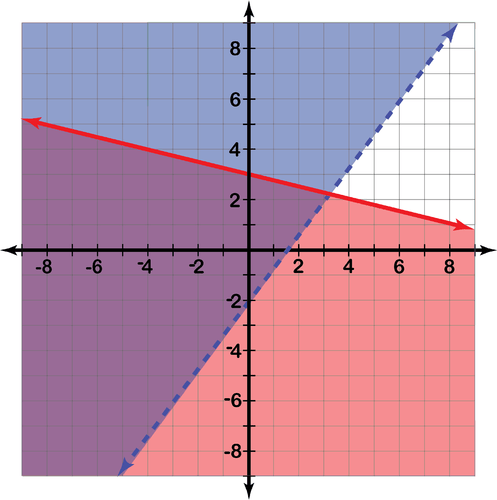
::y=13x+5y>54x-2Solution: Since both of these inequalities are given in slope-intercept form , we can use the y- intercept and the to graph the lines. T he first inequality has “ ” we will make a solid line to indicate that the line is included in the solution set and shade below the line where is “less than” (where the y- axis is below) the line.
::解决方案 : 由于这两种不平等都以斜坡截面形式给出, 我们可以使用 y 截面和线条图。 第一个不平等有“ y ” , 我们将绘制一条坚固的线, 以显示该线包含在 y 的“ 低于 y 轴 低于 ” ( y 轴低于 y) 的线下。The second inequality has “ ”, we will make a dashed line to indicate that the line is not included in the solution and shade above the line where is “greater” (where the y- axis is above) the line. The first inequality is graphed in blue and the second inequality is graphed in red . The overlap of the shaded regions ( purple shading) represents the solution. Any point in this shaded region is a solution to the system of inequalities.
::第二个不平等是“y>”,我们将用一条破折的线来表示该线没有包括在“y-轴”在“y-轴”在“y-轴”在“y-轴”在“y-轴”在“y-轴”在“y”在“y-轴”在“y-轴”在“y”在“y-轴”在“y-轴”在“y-轴”在“y”在“y-轴”在“y”在“y”在“y-轴”在“y”在“y-轴”在“y-轴”在“y-轴”在“y”在“y-轴”在“y-轴”在“y-轴”的线上,第一个不平等是用蓝色图表绘制的,第二个不平等以红色在“y-轴”以“y-轴”在“y-轴”在“y-轴”的线上,“y”在“y-轴”的线上,我们将用一条“y-轴上,”在“y-轴的线上,以“y-轴线上方,”的“y-轴在“y-轴上”在“y-轴上”在“y-轴线上,我们将用“y-轴中包括”表示“y-轴”表示“y-轴”表示“y-轴”表示“y”的“y-轴的“y-轴”的“y-轴”的“y-轴”的“y-轴上方,”的“y-轴”的“y”线上方,我们将表示“和“和“y-轴没有”表示“y”的“y”的“y”线上”的“y”的“y”线上方,我们将用“和“y”的“y”划线上,”的“y”的“y”的“y”的“y”的“y是“y”线上,”划线上,”表示“y”表示“y”表示是“和“和“和“和“和“和“和“和“和“和“和”的”的”的“和“和”的“和“和“和”划线上”划线上”划线上”的“和“和“和“by Mathispower4u demonstrates how to graph the solution to a system of linear inequalities.
::Mathispower4u 展示了如何绘制线性不平等体系的解决方案。Example 4
::例4Graph and identify the solution to the system:
::图形和确定系统解决方案:
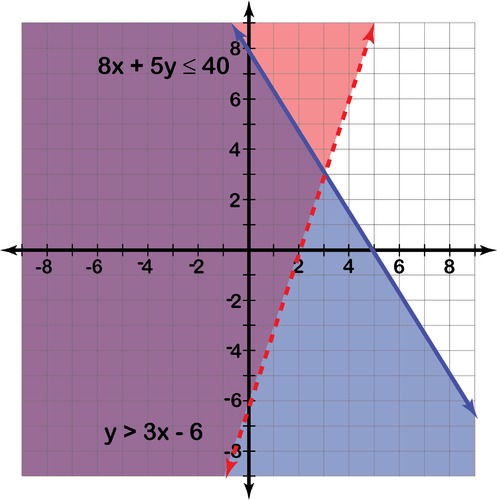
::8+5y_403x-y < 6Solution: Let’s graph the boundary lines by identifying the intercepts for each equation .
::解答:让我们通过识别每个方程式的截取量来绘制边界线图。For , the intercepts are (5, 0) and (0, 8). T he symbol is so the line is solid.
::对于 8x+5y40, 拦截是( 5, 0) 和( 0, 8) 。 符号是 , 所以线是固态的 。For , the intercepts are (2, 0) and (0, -6). T he symbol is so the line is dashed.
::对于 3x-y < 6, 拦截次数为 (2, 0) 和 (0, - 6) 。 符号为 < 因此线被破折 。Now, use test points to determine in which direction to shade. (0, 0) is a good choice for a test point.
::现在,使用测试点来确定阴影的方向。 (0, 0) 是一个测试点的好选择 。This is also a true statement, so (0, 0) is a solution to the inequality and we can shade on the side of the line that includes (0, 0).
::这也是一个真实的说法,所以(0,0)是解决不平等的一种解决办法,我们可以在包括(0,0)的线的侧面遮蔽。Since this is a true statement, (0, 0) is a solution to the inequality and we can shade on the side of the line that includes (0, 0).
::由于这是真实的说法,(0,0)是解决不平等的一种解决办法,我们可以在包括(0,0)的线的侧面遮蔽。Again, inequality 1 is graphed in blue and inequality 2 is graphed in red . The overlap of the shaded regions ( purple shading) represents the solution.
::同样,不平等1以蓝色为图表,不平等2以红色为图表。 阴影区域(净阴影)的重叠代表了解决方案。by CK-12 demonstrates how to graph systems of linear inequalities.
::CK-12展示了如何绘制线性不平等系统图。Example 5
::例5Graph and identify the solution to the system:
::图形和确定系统解决方案:
::y 23x+2y\\\\\\\\\\\\\\\\\\\\\\\\\\\\\\\\\\\\\\\\\\\\\\\\\\\\\\\\\\\\\\\\\\\\\\\\\\\\\\\\\\\\\\\\\\\\\\\\\\\\\\\\\\\\\\\\\\\\\\\\\\\\\\\\\\\\\\\\\\\\\\\\\\\\\\\\\\\\\\\\\\\\\\\\\\\\\\\\\\\\\\\\\\\\\\\\\\\\\\\\\\\\\\\\\\\\\\\\\\\\\\\\\\\\\\\\\\\\\\\\\\\\\\\\\\\\\\\\\\\\\\\\\\\\\\\\\\\\\\\\\\\\\\\\\\\\\\\\\\\\\\\\\\\\\\\\\\\\\\\\\\\\\\\\\\\\\\\\\\\\\\\\\\\\\\\\\\\\\\\\\\\\\\\\\\\\\\\\\\\\\\\\\\\\\\\\\\\\\\\\\\\\\\\\\\\\\\\\\\\\\\\\\\\\\\\\\\\\\\\\\\\\\\\\\\\\\\\\\\\\\\\\\\\\\\\\\\\\\\\\\\\\\\\\\\\\\\\\\\\\\\Solution: Since the first inequality has “ ,” we will make a solid line to indicate that the boundary line is included in the solution and shade above the line where is “greater” than the y -values on the line. The second inequality also has a solid line for the boundary line since it is “ ." We will shade below the line where is “less than” the y -values on the line.
::解决方案 : 由于第一个不平等是“ ” , 我们将绘制一条坚实的线, 以表明边界线包含在 y “ 大于 y 值 ” 的界线之上的解决方案和阴影中。 第二个不平等也为边界线划定了一条坚实的线, 因为它是“ ” 。 我们将在 y “ 低于” y 值 的线下阴影。Inequality 1 is graphed in blue and inequality 2 is graphed in red . In this case the regions do not overlap. This indicates that there is no solution to the system.
::不平等 1 以蓝色图解, 不平等 2 以红色图解。 在此情况下, 地区不重叠, 这表明系统没有解决方案 。by MathWOEs demonstrates how to solve a system of linear inequalities.
::数学、专业和经济学专业组织展示了如何解决线性不平等制度。Example 6
::例6Graph the system of linear inequalities:
::线性不平等体系图:
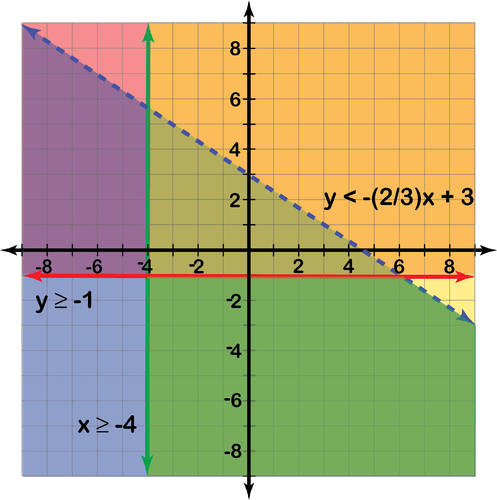
::y 23x+3y1x4Solution: We can graph a system of three linear inequalities by graphing all of the inequalities on the same graph. The solution to the system is the region where the shading for all three inequalities overlap.
::解决方案:我们可以通过在同一图中绘制所有不平等的图解来绘制三个线性不平等体系的图解。 这个体系的解决方案是所有三种不平等的阴影重叠的区域。This inequality has a y- intercept of 3 and slope of . Since the inequality is <, we will shade below the dashed blue line.
::y&23x+3+3+23+23+23+23+23+23+23+23+23+23+23+23。由于不平等 <,我们将在破折的蓝线下阴影。This is a horizontal line through (0, -1). The line will be solid and we shade above the red line.
::这是一条横直线通过( 0, - 1) 。 这条线将是固态的, 我们在红线上方阴影 。This is a vertical line through (-4, 0). The line will be solid and we will shade yellow to the right of the green line.
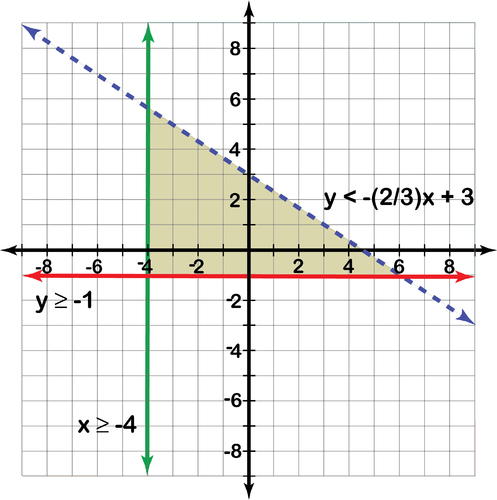
::这是一条垂直直线通过( 4, 0) 。 这条直线将是固态的, 我们将向绿线右边的黄色阴影 。The solution to this system is the shaded region (triangular region) in the center where all three shaded regions overlap. This region can be difficult to see in a graph so it is common practice to erase the shading that is not a part of the solution to make the solution region easier to see .
::该系统的解决方案是位于三个阴影区域重叠的中心的阴影区域( 三角区域 ) 。 这个区域可能很难在图表中看到, 因此通常的做法是消除阴影, 而不是让解决方案区域更容易看到的解决办法的一部分 。Example 7
::例7It is recommended that cat food contain at least 25% protein and at most 50% fat for an adult cat. If a 156 gram can of cat food contains chicken that is 0.27 gram of protein and 0.14 gram of fat per gram of chicken and turkey that is 0.14 gram of protein and 0.06 gram of fat per gram of turkey, what combinations of chicken and turkey can be in a can of cat food to satisfy the recommendations?
::建议猫食中至少含有25%的蛋白质,成年猫最多含有50%的脂肪;如果156克猫食中含有鸡,即0.27克蛋白质,每克鸡和火鸡有0.14克脂肪,即0.14克蛋白质,每克火鸡有0.06克脂肪;如果156克猫食中含有0.27克蛋白质,每克鸡和火鸡有0.14克脂肪,即每克火鸡有0.14克蛋白质,每克火鸡有0.06克脂肪,那么在猫食中,为满足建议,鸡和火鸡的组合是什么?Solution: Let c be the number of grams of chicken and t be the number of grams of turkey. From the information, we know that the
::解答:让C是鸡的克数,T是火鸡克数。根据信息,我们知道
::027c+0.18t0.25(156)=39克蛋白质0.14c+0.06t0.5(156)=78克脂肪If we want to graph the boundary lines by finding the intercepts, we have
::如果我们想通过找到拦截 来绘制边界线,我们有
::0.27c+0.18(0)=39c=144.4(144.4,0)0.27(0)+0.18t=39t=216.7(0,216.7)0.14c+0.06(0)=78c=557.1(557.1,0)0.14(0)+0.06t=78t=1300(0,1300)For the first inequality, we will shade above the line, and for the second inequality, we will shade below the line.
::对于第一个不平等,我们将在线上阴影,对于第二个不平等,我们将在线下阴影。
We also know the total amount of food in the can is 156 grams. We can express that as an equation, , and see where the line intersects the solution region.
::我们还知道罐子里的食物总量是156克。我们可以用方程式来表达这一点,C+t=156,然后看看这条线与解决方案区域交叉之处。
The line intersects the solution region when and .
::当 c=121.4 克和 t=34.6 克时,该线将溶液区域相交。How to Solve a System of Linear Inequalities With Desmos
::如何解决一线性不平等体系Enter both inequalities into Desmos. The region where the two inequalities both shade the graph is the solution set. There are inequality symbols in the keyboard menu on the bottom left.
::将两种不平等都输入 Desmos 中。 在区域中, 两种不平等都对图形进行阴影, 是设定的解决方案 。 在左下方键盘菜单中存在不平等符号 。
How to Solve a System of Linear Inequalities With a TI-83/84
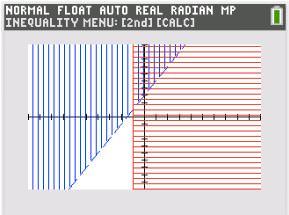
::如何用TI-83/84解决线性不平等体系Enter both inequalities into Y= . To get the inequality symbols, move the cursor over the equal sign and press ENTER . The region where the two inequalities both shade the graph is the solution set.
::将两种不平等都输入 Y= 。 要获得不平等符号, 请将光标移动到等号上, 并按 ENTER 键。 两种不平等都阴影在图形中的区域是解决方案集 。Summary
::摘要-
To graph a system of linear inequalities, graph each inequality on the same set of axes. The solution is the region where the shading for both inequalities overlaps.
::要绘制线性不平等体系图,请用图表显示同一组轴上的每一种不平等。 解决方案是两种不平等的阴影重叠的区域。
R eview
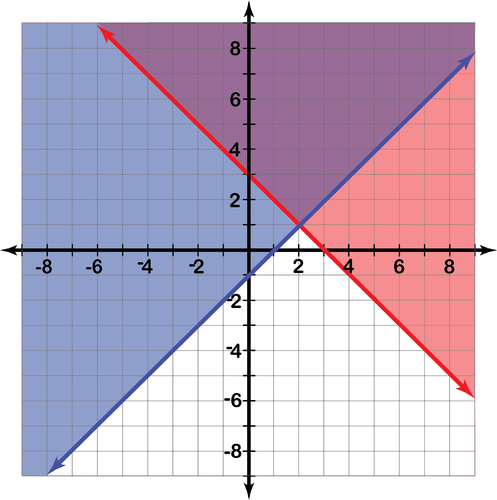
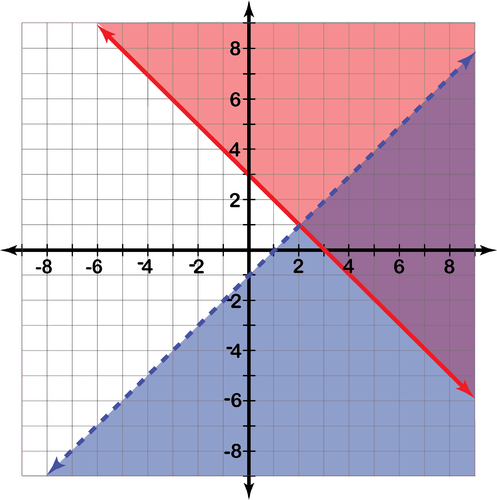
::回顾1. Determine whether the given points are solutions to the systems shown in the graph below.
::1. 确定给定点是否是下图所示系统的解决办法。a. (-3, 3)
::a. (-3,3)b. (4, 2)
::b. (4,2) b. (4,2)c. (3, 2)
::c. (3,3,2)d. (-4, 4)
::d. d. (-4,4)2. Determine in which systems below (-2,-1) is a solution.
::2. 确定以下系统(-2-1)是哪一种解决办法。A.
::A. A.B.
::B. B. .C.
::C. 中 国 家D.
::D. 专 计 D.Graph the following systems of linear inequalities.
::线性不平等制度如下图所示。3.
::y>12x- 24x+6y244.
::y3x+5 y34x - 1y>3x+55.
6.
::5 - 2y10y13x+27.
::y45x- 3y>x8.
9.
::7-3y%21x-4y<810.
11.
12.
::y2x+4y=5x+4y>12x-113.
14.
::x2x43x+5y>1515.
::2x+3y>65x-2y_%10x-3y>3Explore More
::探索更多1. At the beginning of the semester, you go shopping for your supplies for the year. You are shopping for notebooks and packages of pens. You do not want to buy more than 15 items . Notebooks cost $3 each and packs of pens cost $5 each. You have $60 to spend. Graph the system to see what combinations of notebooks and packages of pens you can buy.
::1. 学期开始时,你购买年度用品,购买笔记本和笔包,购买15件以上的笔记本和笔包,每件笔记本花3美元,每包笔花5美元,要花60美元,绘制系统图,看可以买多少笔记本和笔包。below by CK-12 shows a similar problem.
::下面的 CK-12 显示类似的问题 。
2. For your science class, you have to submit at least 10 labs and class summaries. If at least 5 of those have to be labs and at least 7 of those have to be class summaries, graph a system of inequalities to show what combinations of labs and class summaries you can submit to meet the requirements of the class.
::2. 对于你的科学类,你必须至少提交10个实验室和班级摘要,如果其中至少5个必须是实验室,至少7个必须是班级摘要,请用图表显示一种不平等制度,以显示实验室和班级摘要的组合,以满足班级的要求。3. You are catching lobsters and crabs. You can sell the lobsters for $7 each and the crabs for $4 each. State law says you can not catch more than 25 lobsters and crabs in one day or $80 worth of shellfish. Graph a system of inequalities that shows what combinations of lobsters and crabs you can catch.
::3. 捕捉龙虾和螃蟹:每只龙虾7美元,螃蟹4美元; 国家法律规定,一天不能捕捉超过25只龙虾和螃蟹,一天不能捕捉超过25只龙虾和螃蟹或价值80美元的贝类。 绘制一个不平等体系,显示龙虾和螃蟹的组合。below by CK-12 shows a similar problem.
::下面的 CK-12 显示类似的问题 。
Answers to Review and Explore More Problems
::对审查和探讨更多问题的答复Please see the Appendix.
::请参看附录。PLIX
::PLIXTry this interactive that reinforces the concepts explored in this section:
::尝试这一互动,强化本节所探讨的概念:/
References
::参考参考资料1. "Protein Requirements for Good Cat Nutrition," last accessed May 17, 2017, http://www.peteducation.com/article.cfm?c=1+1399&aid=701.
::1. " 保护好猫咪营养的要求 " ,2017年5月17日最后一次查阅,http://www.peteducation.com/article.cfm?c=1+1399&aid=701。 -
To graph a system of linear inequalities, graph each inequality on the same set of axes. The solution is the region where the shading for both inequalities overlaps.
