刻度函数
章节大纲
-
Volleyball players want to keep their serves as close to the net as possible, so the ball travels for a shorter period of time. Say a volleyball player serves the ball across the court. If we can model this situation with the function , where x is the distance from the player and y is the height, then we can determine if the ball clears the net and lands in bounds 61 feet away 1 . It may be helpful to analyze this situation graphically, and we consider how to do that in this section.
::排球运动员想让自己的球队尽可能接近网球,所以球队可以短时间飞行。说排球运动员可以横跨球场。如果我们能用 y=- 0.006(x- 212)+9 的函数来模拟这种情况,x是球员的距离,y是高度,那么我们可以确定球队是否清除网线,在61英尺的距离内降落。也许用图表分析这个情况有帮助,我们在本节中考虑如何这样做。
Quadratic Functions
::二次曲线函数In this section, we consider two forms of a quadratic function .
::在本节中,我们考虑了二次函数的两种形式。Forms of Quadratic Functions
::二次函数的形式The general form of a quadratic function is
::二次函数的一般形式是
::y=f(x)=ax2+bx+c,where and are real numbers and .
::a、b和c为实际数字和a++0。The standard form of a quadratic function is
::二次函数的标准形式是where and are real numbers and .
::y=f(x)=a(x-h)2+k,其中a、h和k为实际数字和a++0。Previously in this chapter, we focused on determining when a quadratic function is equal to 0 . Now, y can take on many values.
::在本章之前,我们的重点是确定二次函数何时等于0。现在,你可以接受许多数值。
::刻度函数The shape of the graph of a quadratic function is called a and looks like the U- shape in the figure below. The turning point on the parabola—the point where the graph goes from decreasing to increasing, or vice versa—is called the . Notice that this parabola is symmetrical about a vertical line that passes through the vertex . This line is called the axis of . The points on this line, except the vertex, do not satisfy the function. The axis of symmetry is not part of the graph, so we draw it as a dashed line. Lastly, where the parabola passes through the y- axis is the y- intercept , and where the parabola passes through the x- axis are the x- intercepts .
::二次函数的图形形状被称为 parbola, 看起来像下图中的 U 形状。 parbola 的转折点是 顶点, 即 parbola 的从下降到增加的点, 反之亦然。 请注意, 此 parbola 是垂直线的对称性, 穿过顶端。 此线称为 轴 。 此线上的点, 除顶点外 , 无法满足此函数 。 对称性轴不是 图形的一部分, 因此我们把它画为破折线 。 最后, parbola 穿过 y- 轴是 y 界面, 而 parbola 穿过 x 轴是 x 界面 。
This video by CK-12 demonstrates how to identify components of quadratic functions.
::CK-12的这段视频展示了如何辨别二次函数的成分。Finding Properties of a Parabola, and How to Graph a Parabola
::查找 parabola 属性, 如何绘制 parabola 属性Vertex
::顶点-
General Form: The
x-
coordinate of the vertex is
. To find
, plug in this value to the
function
,
.
::常规窗体: 顶点的 x 坐标为 x=- b2a。 要查找 y, 请在此值中插入此值, f(- b2a) 。 -
Standard Form
:
::标准表格h,k)
Axis of Symmetry
::对称原则的轴心-
General Form:
is also the
equation
of the axis of symmetry.
::一般窗体:x=-b2a也是对称轴的方程式。 -
Standard Form:
::标准表格: x=h
x- intercepts: Set the function equal to 0 and solve the quadratic equation .
::x 界面: 设定函数等于 0, 并解析二次方程 。y- intercept: Set .
How to Graph a Parabola
::y 界面: 设置 x=0. 如何绘制 parabola1. Find the vertex.
::1. 找到顶部。2. Choose two x− values that are less than the x− value of the vertex, and two x− values that are greater than the x− value of the vertex. Evaluate the function for each of those values.
::2. 选择两个小于顶点的X-值的x-值和两个大于顶点的X-值的x-值。3. Plot the five points and graph the parabola.
::3. 绘制五点图,绘制抛物线图。Example 1
::例1Graph .
::图y=x2。Solution: First we need to find the vertex: . The vertex is (0,0).
::解决方案 : 首先我们需要找到顶点 : x=- b2a=-02_1=0, y=02=0。 顶点是 0,0 。Next we need to create a table of values with the vertex in the middle.
::接下来,我们需要创建一个带有中间顶点的数值表。x y -2 -1 0 0 1 2 Lastly, graph the values on the coordinate plane .
::最后,请在坐标平面上绘制数值图。
The origin is both the x- and y- intercept. The line is the axis of symmetry.
::源为 X 和 y 界面。 行 x= 0 是对称轴 。Graphing Quadratic Functions in Standard Form
::在标准表格中绘制二次函数图Standard form allows us to recognize transformations of the basic graph . As we saw in the section on transformations of functions in Chapter 5, and all play a role in the location of the graph in the plane.
::标准窗体允许我们识别基本图形 y=x2 的转换。 正如我们在第五章a、h和k关于函数转换的章节中看到的那样,在平面中的图形位置中,所有功能转换都发挥作用。-
affects dilations, and
if it is negative, reflects about the
x-
axis.
::a 影响膨胀,如果为负,则反映 X 轴。 -
causes horizontal
shifts
to the left and the right.
::h 导致向左和向右水平移动。 -
causes
vertical shifts
up and down.
::k 导致垂直向上和向下移动。
Example 2
::例2Graph .
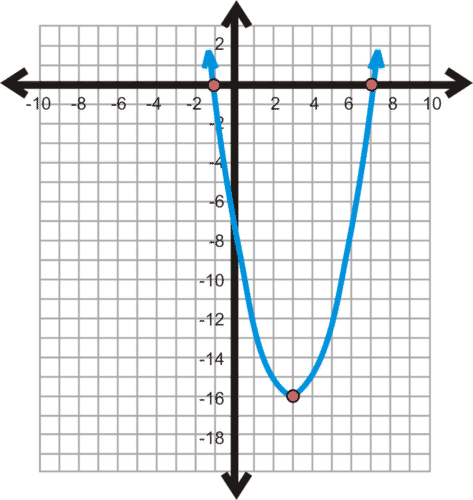
::图y=(x-3)2-16。Solution: The vertex is (3, -16).
::解决方案:顶点是(3, -16) 。Next we make a table of values with (3, -16) in the middle.
::接下来我们用中间的值( 3, - 16) 绘制一个数值表 。-1 1 3 -16 5 7 Now, plot the points and draw the parabola. Notice that this graph is essentially the graph of moved 3 units to the right and 16 units down.
::现在, 绘制点并绘制抛物线。 请注意, 此图基本上是 y=x2 的图形, 将 3 个单位移到右边, 并将 16 个单位下移 。The x- intercepts are (-1,0) and (7,0). The graph crosses the y- axis at (0,-7). The line is the axis of symmetry.
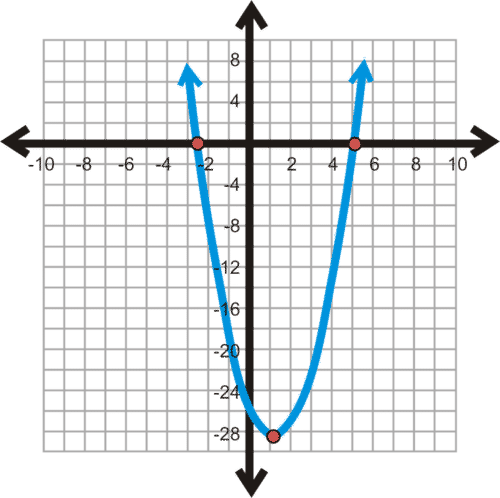
::x 截取值是 (-1,0) 和 (7,0) 。 图形横过 y 轴( 0, 7) 。 线 x= 3 是对称轴 。Example 3
::例3Graph .
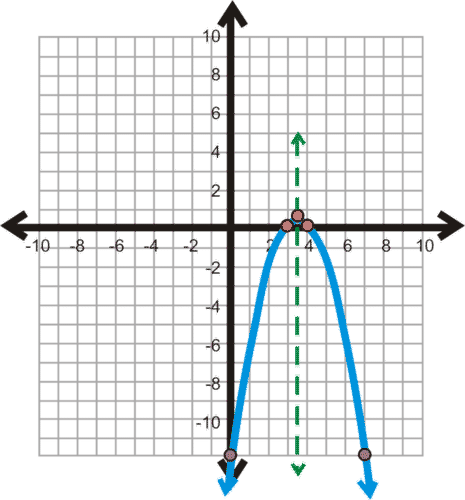
::图y=-(x-72)2+14。Solution: The vertex is .
::解决方案:顶点是(72,14)。Next we make our table of values. We want to select two values to the left of the vertex and two values to the right of the vertex . When picking values for our table, we do not need to pick because the vertex contains fractions.
::接下来我们绘制我们的值表。 我们要在顶点左边选择两个值, 在顶点右边选择两个值。 在为表格选择值时, 我们不需要选择, 因为顶点含有分数 。0 3 4 7 Plot all the points you found above. Then connect the points to create the parabola.
::绘制您在上面找到的所有点。 然后连接这些点来创建抛物线 。The x- intercepts are (3, 0) and (4, 0). The y- intercept is (0, -12). The axis of symmetry is .
::x 截取是 (3, 0) 和 (4, 0) 。 y 截取是 (0, - 12) 。 对称轴是 x= 72 。by Mathispower4u demonstrates how to graph quadratic functions in standard form.
::由 Mathispower4u 演示如何用标准格式绘制二次函数。Example 4
::例4Graph .
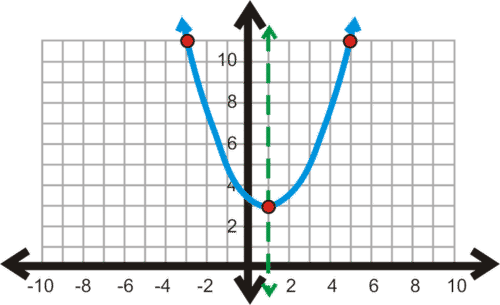
::图y=12(x-1)2+3。Solution: The vertex is (1, 3).
::解决方案:顶点是(1, 3) 。-3 -1 1 3 3 5 We plot the points and draw the parabola.
::我们绘制点和抛物线Since the graph never crosses the x-
::由于图形从未跨过 x 轴, 因此没有 x 界面。 y 界面是 (0, 3. 5) 。 对称轴是 x= 1 。
::以一般格式绘制二次函数图Example 5
::例5Graph .
::图y12x2-2x+6。Solution: First, let's find the vertex by using .
::解答:首先,让我们使用 x=-b2a 来找到顶点。
::x=-(22-)-12)=-(-2-1)=-2Plug this into the function: . Therefore , the vertex is (-2, 8).
::插入函数 y= 12(-2)2-2(-2)+6= 2+4+6=8) 。 因此,顶点是 (-2) 8 。-6 -4 -2 8 0 2 Plot the five points to form the parabola.
::绘制五点组成抛物线。The x- intercepts are (-6, 0) and (2, 0). T he y- intercept is (0, 6), and t he axis of symmetry is .
::x 截取是 (-6, 0) 和 ( 2, 0) 。 y 截取是 (0, 6) , 对称轴是 x= 2 。Example 6
::例6Graph .
::图y=2x2-5x-25。Solution: To find the vertex, use .
::解决方案: 要找到顶端, 请使用 x=- b2a. x=--522=54 。Now, find :
::现在,请见y:y=2(542)-2-5(54)-2-5(54)-25=258-254-254-225=225=225=225=225=225=225=2818The vertex is .
::顶部是(54,2818)Next, we make a table of values.
::接下来,我们绘制一个价值表。-3 0 3 5 Plot the points and draw the parabola. Notice the scale on the x- axis and the scale on the y- axis are not the same. This is allowed as long as the labeling is consistent on each axis. For example, each box cannot be worth 1 unit on the positive side of the x- axis, but worth 3 units on the negative side.
::绘制点并绘制抛物线。 注意 X 轴和 y 轴的缩放是不一样的。 只要每个轴的标签一致, 允许这样做。 例如, 每个框不能在 x 轴的正侧值为1 个单位, 但负面值为3 个单位 。From factoring, we get that the x- intercepts are (5, 0) and . The y- intercept is (0,-25), and the axis of symmetry is .
::从乘数中,我们可以看到 X 截取是 (5,0) 和 (-52,0) 。 y 截取是 (0, 25) , 对称轴是 x=54 。Properties of Note
::注释注释属性-
If
, the parabola opens upward. If
, the parabola opens downward.
::a>0, 抛物线向上打开。如果 <0, 抛物线向下打开。 -
In the previous section, we discussed the
discriminant
. The discriminant tells us the types of solutions we would have to the quadratic equation. As we have seen in this section, the solutions to the quadratic equation are the
x-
intercepts. The discriminant tells us the following:
::在前一节中,我们讨论了对立问题。对立问题告诉我们我们对于四等式会有什么样的解决办法。正如我们在本节中看到的那样,四等式的解决方法是 X 界面。对立问题告诉我们: -
If the discriminant is positive, there will be two
x-
intercepts.
::如果争议是正面的, 将会有两个 X 拦截点 。 -
If the discriminant is 0, there will be one
x-
intercept.
::如果辩驳者是0, 就会有一个 X 拦截 。 -
If the discriminant is negative, there will be no
x-
intercepts.
::如果对立是否定的, 就不会有 X 拦截 。
by Mathispower4u demonstrates how to graph quadratic functions in the general form.
::由 Mathispower4u 演示如何用一般形式绘制二次函数。How to Graph a Quadratic Function With Desmos
::如何用 Desmos 绘制二次函数1. Type . Enter in the equation.
::1. y 类型 y =. 在方程中输入。If your graph does not look like a parabola, there may be an issue with your window. Fix the size of your window. In Desmos, use the wrench icon in the upper right to change the range of the axes.
::如果您的图形看起来不像抛物线, 您的窗口可能会有问题 。 确定窗口的大小 。 在 Desmos 中, 请使用右上角的扳手图标来改变轴的范围 。2. To find the vertex in Desmos, click on the vertex. The point will be highlighted.
::2. 要在 Desmos 中找到顶点,请单击顶点。此点将被突出显示。3. To find the intercepts in Desmos, click on the points to highlight them.
::3. 为在Desmos找到X-拦截点,请点击这些点以突出它们。How to Graph a Quadratic Function With a TI-83/84
::如何用 TI-83/84 绘制 Quadratic 函数图1. Type Y= button. Enter in the equation. If your graph does not look like a parabola, there may be an issue with your window. Fix the size of your window. On a TI-83/43, press ZOOM and then 6:ZStandard , ENTER .
::1. Y=按钮。输入方程式。如果您的图形看起来不像抛物线, 窗口可能会有问题。 调整窗口的大小。 在 TI- 83/43 上, 按 ZOOM 键, 然后 6: ZStandard, ENTER 键。2. On a TI-83/84, press 2nd TRACE (CALC ). The Calculate menu will appear. Select 4:maximum or 5:minimum , ENTER . The screen will return to your graph. Now you need to tell the calculator the Left Bound. Using the arrows, arrow over to the left side of the vertex, press ENTER . Repeat this for the Right Bound. The calculator then takes a guess, press ENTER again.
::2. 在 TI-83/84 上,请按 第 2 TRACE (CALC) 。 计算菜单将出现。 选择 4 : 最大 或 5 : 最小, ENTER 。 屏幕将返回您的图表。 现在您需要告诉计算器左圆。 使用箭头, 箭头向左对面的顶端, 按 ENTER 。 重复一遍, 右圆 。 计算器然后猜测, 再按 ENTER 。3. On a TI-83/84, press 2nd TRACE (CALC) . Select 2:Zero, ENTER . The screen will return to your graph. Let's focus on the left-most intercept. Now you need to tell the calculator the Left Bound. Using the arrows, arrow over to the left side of the vertex, press ENTER . Repeat this for the Right Bound (keep the bounds close to the intercept). The calculator then takes a guess; press ENTER again.
::3. 在 TI-83/84 上,请按 第 2 TRACE (CALC) 。 选择 2: 零 , ENTER 。 屏幕将返回您的图表 。 让我们集中关注最左边的截取点 。 现在, 您需要告诉计算器左环 。 使用箭头, 箭头向左对面的顶端, 按 ENTER 。 重复一遍 , 右环( 保持接近截取的界限 ) 。 计算器然后猜测 ; 再按 ENTER 。Example 7
::例7A volleyball player serves the ball across the court. We can model this situation with the function , where is the distance from the player and is the height of the ball above the court. Graph the parabola and determine if the ball clears the net 31 feet away and lands in bounds 61 feet away 1 .
::排球球员在球场上为球打球。 我们可以用 y=- 0.006(x-212)2+9 的函数来模拟这个情况, x 是球员的距离, y 是球在球场上方的高度。 绘制抛物线, 并确定球是否在31英尺外清除了网, 并在61英尺外着陆 。Solution: We can graph this on a graphing utility, like Desmos, and analyze our graph.
::解答:我们可以用图解工具来图解这个图解, 就像Desmos, 分析我们的图解。
By entering the function into the utility, we get a graph.
::通过输入该函数进入工具,我们可以得到一个图表。At 0 feet from the player, the ball is hit at a height of 6.345 feet. It then travels up until it reaches its maximum height of 9 feet, when it is 21 feet away from the player.
::在距离球员0英尺处,球被击中高度为6.345英尺,然后向上飞到最高9英尺,距离球员21英尺。As the ball travels down, at 31 feet away from the player, which is the location of the net, the ball is at a height of 8.4 feet. We can find this exact value in Desmos by evaluating the function, as seen on the 2nd line. The height of a volleyball net is at most 7 feet inches, so the ball clears the net.
::当球向下移动时,球在距离球员31英尺(即网的位置)的距离,球身高度为8.4英尺。我们可以通过对函数进行评估来发现德莫斯的这个精确值,如第二线所示。排球网的高度最多为7英尺1158英寸,所以球能清除网。Lastly, the ball lands 59.73 feet away from the player, which is in bounds. Desmos can determine this by solving the quadratic equation associated with this function. That is on the 3rd line on the left.
::最后,球在距离球员59.73英尺处,距离球员的界限。德莫斯可以通过解决与此函数相关的二次方程来确定这一点。在左侧第三线。Feature: Parabolic Perfection
::特征: 抛弧完美by Diane Seely
::作者:Diane SeellyDo you think a computer's calculations could help you perfect your free-throw shot more successfully than a coach? Inventors of a new sports technology tool think so. The parabolic path of a basketball shot can be interpreted and measured with math!
::你认为计算机的计算能帮助你比教练更成功地完成你的自由投篮射击吗? 新的体育技术工具的发明者这样认为。 篮球射击的抛物线路径可以用数学来解释和测量!
News You Can Use
::您可以使用新闻新闻In the early 2000s, four Silicon Valley friends put their heads together and created "Noah," a sports technology machine intended to help basketball shooters "build the perfect arc." If you picture a free throw as an upside-down parabola, you might see how being able to mathematically measure that parabola could help you analyze your shot. Noah's Arc does just that. The machine measures the angle of the shot's arc as well as the shot's depth at entry of the hoop and gives verbal feedback to the practicing shooter.
::2000年代初,四个硅谷朋友把他们的脑袋放在一起,并创建了“诺亚 ” ( Noah ) , 一个体育技术机器旨在帮助篮球射手“建立完美的弧 ” 。 如果你把一个自由投球想象成一个倒向的抛物线, 你可能会看到如何用数学测量抛物线能帮助你分析自己的射击。诺亚的弧就是如此。机器测量了射击弧的角以及球圈入口处的射击深度,并向练习射击者提供了口头反馈。by Noah Basketball demonstrates how basketball players use the shot arc and shot depth to optimize their shooting.
::诺亚篮球展示篮球运动员如何使用射击弧和射击深度优化射击。Summary
::摘要-
To graph quadratic functions either in standard form,
, or general form,
, find the vertex, create a table of values with five points, plot those points, and draw a parabola.
::要用标准格式 y=a(x-h)2+k 或一般格式 y= ax2+bx+c 来图形二次函数,请找到顶点,创建带有五个点的数值表,绘制这些点,并绘制抛物线。 -
If
the parabola opens upward. If
the parabola opens downward.
::a>0, 抛物线向上打开。如果 <0, 抛物线向下打开。
Review
::回顾Graph the following quadratic functions.
::绘制以下二次函数的图。1.
::1.y=(x-4)2-92.
::2. y=x2+2x-83.
::3. y=x2 - 12x+114.
::4.y=-(x+2)2+75.
::5.y=-x2+10x-256.
::6.y=2(x+1)2-37.
::7.y=3(x-2)2+48.
::8. y=-2x2-5x+129.
::9. y=13x2+4x-1510.
::10. y=3x2+26x-911.
::11.y=12x2+5x+28Explore More
::探索更多1. Students A, B, and C each design and build slingshots. After experimenting with their slingshots, they share the following information about the trajectory of a steel ball they shot from their slingshots.
::1. 学生A、B和C各设计和制作弹弓,在试验弹弓后,分享关于从弹弓中射出的钢球轨迹的下列信息。Slingshot A
::弹射AHorizontal distance of the ball in meters
::以米为单位的球水平距离Vertical distance (height) of the ball in meters
::以米计球的垂直距离(高度)5
10
10
30
20
30
25
10
Slingshot B: y axis is vertical distance (height), x axis is horizontal distance (both in meters),
::弹射 B: Y 轴为垂直距离( 高度) , x 轴为水平距离( 以米计) y=- 0.72x2+10x+10Slingshot C:
::发球C:y=-0.5x2+10x+12a. How far (horizontal distance) will each slingshot launch the steel ball?
::a. 每个弹弓发射钢球的距离(横向距离)有多远?b. How high (vertical distance) will each slingshot launch the steel ball?
::b. 每个弹弓发射钢球的高度(垂直距离)如何?c. What are the pros and cons of each slingshot?
::c. 每个弹弓的利弊是什么?2. A stone bridge has a parabolic arch where a river flows under it. At the water level the arch is 1,000 ft wide. The peak of the arch is 200 ft above the water.
::2. 石桥有一个抛物面拱门,河底有一条河流,在水层,拱门宽1 000英尺,顶部在水面上方200英尺。a. Using the left end of the arch (where it meets the water) as the origin, find an equation for the arch. That is, find an equation that gives the height y (in feet) above the water of a point on the arch as a function the point's position x (in feet) in relation to the left endpoint.
::a. 以拱门的左端(与水相接)作为起点,为拱门找到一个方程。也就是说,找到一个方程,使拱门上一个点的水上方的高度 y(以脚计)作为相对于左端点的点位置 x(以脚计)的函数。b. A town along the river wants to place red warning lights on the arch at points 30 ft to the right of its left end, and 30 ft to the left of its right end. At what height will the lights need to be placed?
::b. 沿河的一个城镇希望将红警示灯放在拱门左端30英尺处,右端30英尺处,右端30英尺处。3. Student A is 5 feet tall. Student A shoots the basketball with an initial vertical velocity of 20 ft/sec, which can be modeled by .
::3. 学生A为5英尺高,学生A以最初的垂直速度20英尺/秒向篮球射击,以h(t)=16t2+20t+5进行模拟。a. What will the maximum height of the basketball be?
::a. 篮球最高高度是多少?b. When will the basketball reach its maximum height?
::b. 篮球何时达到最高高度?c. When will the basketball reach the ground?
::c. 篮球何时到达地面?4. Marcus kicks a football to score a field goal. The height of the ball is given by the equation , where y is the height and x is the horizontal distance the ball travels. Did Marcus kick the ball hard enough to go over the goal post, which is 10 feet high?
::4. Marcus踢足球以得分球场球,球的高度由公式y=-3264,400x2+x给出,Y是高度,X是球所穿行的水平距离。Marcus踢球的力度是否足够大,足以越过10英尺高的球场?5. If the x- coordinate of the vertex is for , find the y- coordinate in terms of and .
::5. 如果顶点的 x 坐标为 -b2a y= ax2+bx+c,则以 a、b 和 c 的值查找Y 坐标。6. An arrow is shot straight up into the air from 5 feet above the ground with a velocity of 18 ft/s. The quadratic expression that represents this situation is , where t is the time in seconds. At what time does the arrow reach its maximum height, and what is that height?
::6. 箭头从地面上5英尺直直射向空中,速度为18英尺/秒,表示这种情况的二次表达式为5+18t-16t2,其时间为秒。箭头何时达到最大高度,高度是多少?7. The parent graph of a quadratic function is .
::7. 二次函数的母图为y=x2。Graph and on the same set of axes in the calculator. Describe how affects the shape of the parabola.
::图y=x2,y=3x2,y=12x2 和y=12x2 在计算器中的同一组轴上。描述一个参数如何影响抛物体的形状。Graph , and on the same set of axes in the calculator. Describe how affects the shape of the parabola.
::图y=x2,y=-x2和y=-2x2在计算器中的同一组轴上。描述一个参数如何影响抛物线的形状。Graph , and on the same set of axes in the calculator. Describe how affects the location of the parabola.
::图y=x2,y=(x-1)2,y=(x+4)2,计算器中同一组轴上的y=(x+4)2。描述 h 如何影响抛物线的位置。Graph , and on the same set of axes in the calculator. Describe how affects the location of the parabola.
::图y=x2,y=x2+2,y=x2+5在计算器中的同一组轴上。描述 k 如何影响抛物线的位置 。Answers for Review and Explore More Problems
::回顾和探讨更多问题的答复Please see the Appendix.
::请参看附录。PLIX
::PLIXTry these interactives that reinforce the concepts explored in this section:
::尝试这些强化本节所探讨概念的交互作用 :References
::参考参考资料1. "Volleyball Court Dimensions," last accessed May 26, 2017,
::1. 2017年5月26日最后一次访问的“足球法庭层面”, -
General Form: The
x-
coordinate of the vertex is
. To find
, plug in this value to the
function
,
.