绘图和评估指数函数
章节大纲
-
Introduction
::导言An old legend recorded in 1260 B.C. by Ibn Khallikan, a Kurdish historian, relates a story about how the inventor of chess was asked to name his own reward for creating the game for the king. One version of the story says the man asked the king to choose one of two methods of payment:
::库尔德历史学家Ibn Khallikan在公元前1260年录制的古老传说讲述了国际象棋发明家如何因为国王创造游戏而获得奖赏的故事。-
One million grains of rice for each square of the chessboard.
::棋盘每平方一百万粒大米 -
A single grain of rice for the 1st square of the chessboard, two grains of rice for the 2nd square, four grains of rice for the 3rd, and so on.
The king would simply double these few grains of rice for each successive square of the chessboard.
::象棋牌第一广场的一粒米,第二广场的两粒米,第三广场的四粒米,等等。 国王将给棋盘的每片连续广场的一粒米翻一番。
The king proudly chose the 2nd option, clearly unfamiliar with the power of compounded interest. The mathematical models for each method of payment are as follows:
::国王自豪地选择了第二种选择,显然不熟悉复合利息的力量。-
::P1(x)=1 000 000x -
::P2(x)=2x
The graph below compares the payment methods. Clearly, one method of payment requires a much higher payment than the other, although this is not apparent until the 3rd row of the chessboard.
::下图比较了付款方法,显然,一种付款方法需要比另一种方法高得多的付款,尽管直到棋盘第三排才明显看出这一点。
The 2nd option was the wrong choice. By the 32nd square, the payment was more than 4 billion grains of rice, for a single square. This is an exponential function , the next class of functions to study. Clearly, an important characteristic is the strong growth rate .
::第二个选项是错误的选择。 在第32个广场上,一个广场的付款额是40亿多粒米(P2(32)=232=4,294,967,296),这是一个单一广场。这是一个指数函数,是下一个需要研究的功能类别。显然,一个重要的特征是强劲的增长率。Exponential Functions
::指数函数take the form where and are constants. The constant is the starting amount when . The constant can be any number except 1, and t ells the story about the growth. If the -value is doubling for each unit increase in , then If the -value is halv ing for each unit increase in (which would be decay) , then is . If the -value is increasing by 6% for each unit increase in , then is 1.06.
::以 f(x) = abx 的形式显示,其中 a=0 和 b1, b>0 是常数。 常数a 是当 x=0 时的起始数。 常数b 可以是除 1 以外的任何数字, 并描述增长情况。 如果Y 值是每单位增加 x 的两倍, 那么如果 Y 值是每单位增加 x (将会腐烂) 的减半, 那么b 等于 12. 如果 Y 值是每单位增加 x 的6%, 那么 b 等于 1.06 。Exponential Function
::指数函数An exponential function with base and initial value is defined by:
::具有 b 基值 和 a 初始值的指数函数 f 的指数函数 f , 定义为:or where and is any real number .
::f(x) = abx 或 y= abx, 其中 a0, b>0, b1 和 x 是任何实际数字 。Evaluating Exponential Functions
::评估证据职能Consider the function
::考虑函数 f( x) = 2x 。-
If
,
.
::如果 x=3, f(3)=23=8,则x=8。 -
If
,
.
::如果 x=0, f(0)=20=1,则x=0, f(0)=20=1。 -
If
,
::如果 x% 3, f( - 3) = 2 - 3 = (12) 3 = 18 。 -
If
,
::如果 x10, f(- 10) =2- 10=( 12) 10=11024 。
Graph of the Exponential Function
::指数函数图图Exponential functions can be graphed by inputing -values into the function and plotting the resulting points, or simply by using a graphing calculator.
::可以通过将 x 值输入函数并绘制结果点或仅使用图形计算器来绘制指数函数。Properties of an Exponential Function of the form :
::y=abx, a>0 窗体的指数函数属性:-
is the value of the base. Within the function, as the
-value increases by 1, the
-value is multiplied by the common ratio.
::b 是基值。在函数内,由于X值增加1,y值乘以共同比率。 -
If
, then the curve will be increasing and represent
.
::如果 b>1,则曲线将增加并代表 。 -
If
, then the curve will be decreasing and represent
.
::如果 0<b<1, 那么曲线将会下降并代表 。 -
Every exponential function of the form
will pass through the point
.
will be the
y-intercept
of the function, or its value at
also called the initial value.
::y=abx 窗体的每个指数函数都会通过点 (0,a) 。 a 将是该函数的 Y 界面, 或其在 x=0 的值也称为初始值 。 -
Every exponential function of the form
will have the
domain
and
range
:
::y=abx 窗体的每个指数函数将包含域和范围: Dx xR} 和 Ry y>0, yR} 。
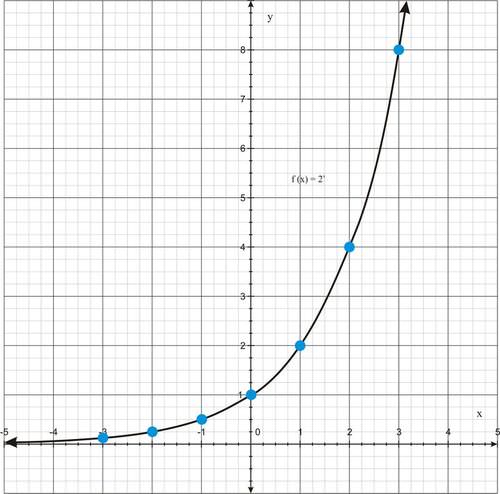
Let’s now consider the graph of
::让我们现在考虑f(x)=2x的图表:Notice that as approaches , the function grows without bound . That is, . However, if approaches , the function values get closer and closer to 0.
::请注意,当 x 接近 { { } 时, 函数会不受约束地成长。 也就是说, f( x) { } 。 但是, 如果 x 接近 { } , 函数值就会越来越接近 0 。Graphing Exponential Functions Using Transformations
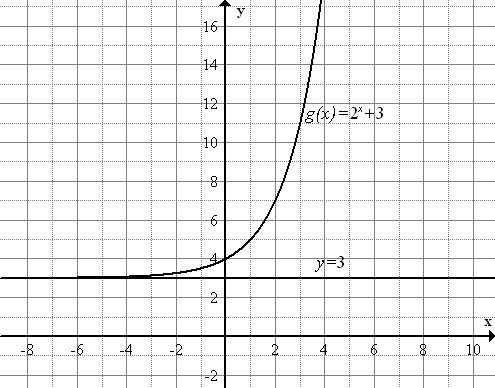
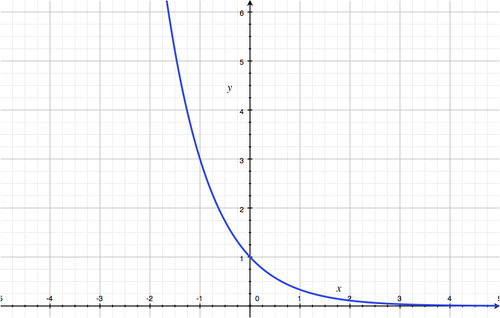
::使用变形绘制指数函数图Graph using transformations . Clearly, it has a vertical shift up 3 units, so the horizontal asymptote of the function is the line . The graph of this function and the horizontal asymptote are shown below:
::图g(x) = 2x+3 使用变换。 显然, 它有一个垂直向上移动 3 个单位, 因此函数的水平同位数是 y= 3 。 此函数和水平同位数的图如下:From the study of transformation of functions, we recognize the graph of as a vertical shift of the graph of The table below summarizes the different kinds of transformations of
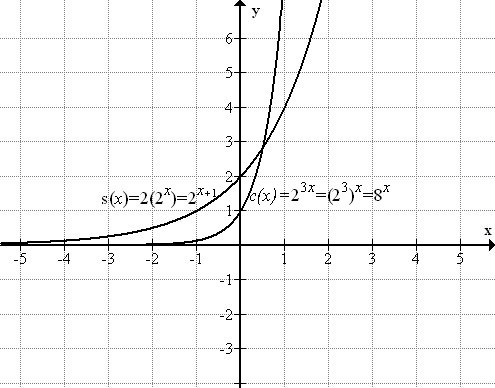
::通过对函数转换的研究,我们确认g(x)=2x+3的图形是f(x)=2x的图形的垂直移动。 下表概述了f(x)=2x的不同类型变换:Equation Relationship to f ( x )=2 x Range Obtain a graph of by shifting the graph of right units. y > 0 Obtain a graph of by shifting the graph of left units . y > 0 Obtain a graph of by shifting the graph of up units. y > a Obtain a graph of by shifting the graph of down units. y > a Obtain a graph of by vertically stretching the graph of by a factor of . y > 0 Obtain a graph of by horizontally compressing the graph of by a factor of . y > 0 Obtain a graph of by reflecting the graph of over the x- axis. y < 0 Obtain a graph of by reflecting the graph of over the y- axis. y > 0 Consider the function and . The 1st function represents a vertical stretch of by a factor of 2. The 2nd function represents a horizontal compression of by a factor of 3. The function is actually the same as another parent function: The function is actually the same as a shift of , The graphs of and are shown below. Notice that the graph of c has a - intercept of 1, while the graph of s has a - intercept of 2.
::考虑 函数 s( x) = 2, 2x 和 c( x) = 23x. 。 函数 1 表示 f( x) = 2x 的垂直伸展, 乘以 2 。 2nd 函数表示 f( x) = 2x 的水平压缩, 乘以 3. 乘以 3. 。 函数 c( x) 等于 23x = ( 23) = 8x 。 函数 s( x) 与 f( x) = 2x, s (x) = 2, 2x= 2x+1. S和 c 的图显示如下。 注意 c 的图形为 y- intercit of 1, 而 s 的图形为 y- intercit of 2 。Exponential Function Properties
::指数函数属性Exponential functions can model either growth or decay. The following graphs demonstrate the general trajectory of an exponential graph. The first graph displays exponential growth and the second graph displays exponential decay.
::指数函数可以模拟增长或衰变。下图显示指数图形的一般轨迹。第一个图显示指数增长,第二个图显示指数衰变。T here are attributes common to each type of exponential function. The table below lists the differences in exponential growth when compared with exponential decay. In the growth functions, the base will be greater than 1 while in decay functions the base will be between 0 and 1. Both growth and decay have matching domain, range, intercepts , and asymptotes . The end behavior is opposite, however. When analyzing exponential functions, we can describe each characteristic as related to the function.
::每个指数函数类型都有共同的属性。下表列出了与指数衰变相比指数增长的差异。在增长函数中,基数将大于1,而在衰变函数中,基数将介于0和1之间。增长和衰变都具有匹配的域、范围、拦截和微粒。但是,最终的行为是相反的。在分析指数函数时,我们可以描述与函数相关的每个特性。Type Growth Decay Function , , Domain Range Intercepts no -intercept, no -intercept, Horizontal Asymptote End behavior Increasing/Decreasing Increasing: Decreasing: Exponential growth and decay are used in measuring financial applications, p opulations of people, bacteria, and any other quantity that grows or decays at a constant rate. One example of exponential decay is carbon dating. Radioactive isotopes such as carbon-14 decay very slowly. It takes about 5,730 years for half of the initial number of carbon-14 molecules in an environment to decay. This is how scientists can date artifacts of ancient humans.
::指数增长和衰变用于测量金融应用、人口、细菌和以恒定速度生长或衰减的任何其他数量。指数衰减的一个例子是碳的去向。放射性同位素,如碳-14的衰减非常缓慢。在一个环境中,最初的碳-14分子数量的一半需要5,730年才能衰减。这就是科学家如何把古代人类的文物的日期定下来。Solving Exponential Equations
::解决指数等号Solving an exponential equation means determining the value of for a given function value. For example, if we have the equation , the solution to the equation is the value of that makes the equation a true statement. Here, the solution is , as 2 3 = 8.
::解析指数方程式意味着确定给定函数值的 x 值。 例如, 如果我们有公式 2x=8, 方程式的解决方案是使方程式成为真实语句的 x 值。 在这里, 解决方案是 x=3 , 以 23 = 8 表示 。Consider a slightly more complicated equation, . Solve this equation by writing both sides of the equation as a power of 2:
::考虑一个略为复杂的方程 3( 2x+1) = 24。 将方程的两侧写成 2 的功率 :
::3(2x+1)=24
::3(2x+1)3=243
::2x+1=8
::2x+1=23To solve the equation now, recall a property of exponents: if , then . That is, if two powers of the same base are equal, the exponents must be equal. This property tells us how to solve
::要解析方程式, 请记住一个引数属性 : 如果 bx=by, 那么 x=y 。 也就是说, 如果同一基点的两个权力相等, 引数必须相等 。 此属性告诉我们如何解答 。
::2x+1=23
::x+1=3
::x=2x=2In this example, it was possible to algebraically solve the equation because both sides of the equation were written as a power of the same exponent . But what if that is not possible?
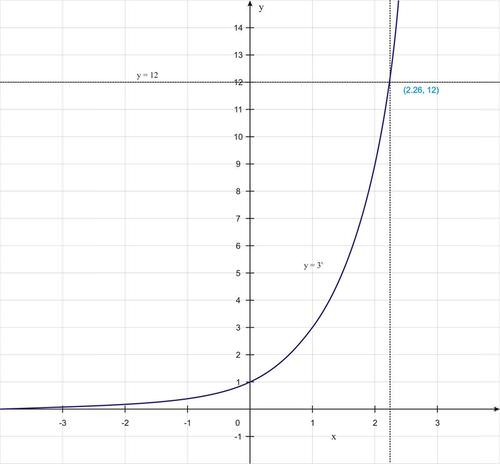
::在这个例子中,可以通过代数解决方程式问题,因为方程式的两边都是写成同一位推手的力量。 但如果这不可能呢?Consider, for example, the equation . It is possible to find the solution to the equation by finding the intersection of and the horizontal line . Using a graphing calculator’s intersection capability, we find that the solution is approximately
::例如,考虑方程式 3x=12。 通过找到y=3x和水平线 y=12 的交叉点,可以找到方程式 3x=12 的解决方案。使用图形计算计算器的交叉能力,我们发现解决方案约为 x=2.26 。The Number and The Function
::编号 e 和 函数 y=exIn geometry, we encountered the number . The number is much like . First, both are irrational numbers: they cannot be expressed as a quotient of integers . Second, both numbers are transcendental: they are not the solution of any polynomial with rational coefficients.
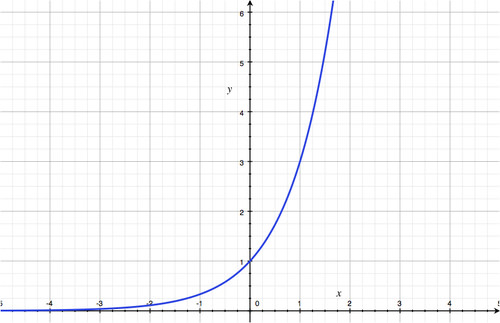
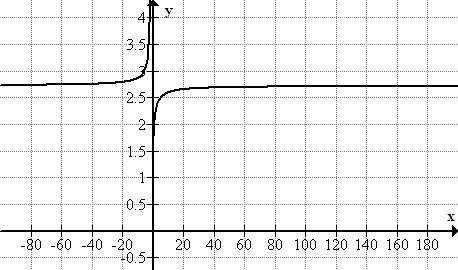
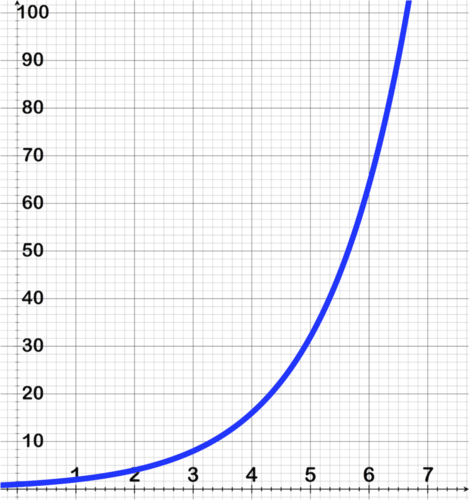
::在几何学中,我们遇到了数字 。数字e 与 非常相似。首先,这两个数字都是非理性数字:不能以整数的商数表示。第二,这两个数字都是超凡的:它们不是任何多元系数与理性系数的解决方案。Like , mathematicians found e to be a natural constant in the world. One way to "discover" e is to consider the end behavior of the function . The graph of this function is shown below:
::和 + 一样,数学家发现 e 是世界上自然常数。 “ 发现” e 的一个方法就是考虑函数 f( x) = ( 1+ 1x) x 的结束行为。 此函数的图示如下:Notice that as approaches infinity, the graph of the function approaches a horizontal asymptote around .
::注意当 x 接近无穷时, 函数的图形会接近 y= 2. 7 周围的水平零点 。x y 0 (not defined) 1 2 2 2.25 5 2.48832 10 2.5937424601 50 2.69158802907 100 2.70481382942 1,000 2.71692393224 5,000 2.7180100501 10,000 2.71814592683 50,000 2.7181825464614 Around , the function values pass 2.7 as increases, but they will never reach 2.8. Since is the -value as approaches infinity, we see that the irrational number is approximately 2.718.
::在 x=100 左右, 函数值随着 x 的增加而通过 2.7 , 但永远不会达到 2.8 。 由于 e 是 x 接近无穷的 Y 值, 我们发现 e 不合理数字 e 约为 2. 718 。The number is used as the base of functions that can be used to model situations involving growth or decay, such as population growth in the absence of predators or resource restrictions.
::数字e被用作可用于模拟增长或衰变情况的功能基础,例如没有捕食者或资源限制的情况下的人口增长。The graph below shows , along with and :
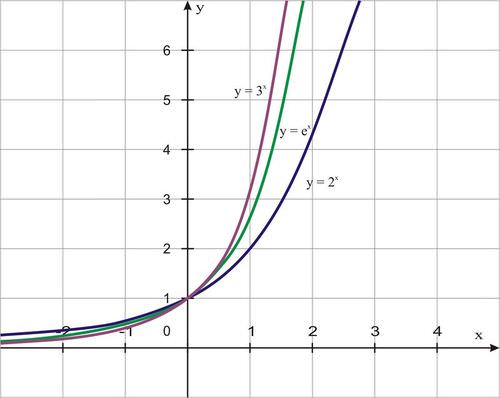
::下图显示y=ex以及y=2x和y=3x:The graph of (in green) has the same shape as the graphs of the other exponential functions. It sits between the graphs of the other two functions. Notice that the graph is closer to than to . All three graphs have the same y- intercept, (0, 1).
::y=ex 的图形( 绿色) 与其他指数函数的图形具有相同的形状。 它位于其他两个函数的图形之间。 请注意, 该图形比 y=3x 更接近 y=2x 。 所有三个图形都有相同的 y 界面, (0, 1) 。Examples
::实例Example 1
::例1Identify which of the functions below are exponential functions and which are not.
::确定以下哪些函数是指数函数,哪些不是指数函数。Since exponential functions are of the form , analyze each function to determine whether they include a constant as the base and variable exponent.
::由于指数函数为y=abx,分析每个函数以确定它们是否包括一个常数作为基数和可变指数。a)
::a) y=x6Solution:
::解决方案 :is not an exponential function because is not in the exponent.
::y=x6 不是一个指数函数, 因为 x 不在指数中 。b)
::b) y=5xSolution:
::解决方案 :is an e xponential function.
::y=5x是一个指数函数。c)
::c) y=1xSolution:
::解决方案 :is not a true exponential function because is always 1, which is a constant function.
::y=1x 不是一个真正的指数函数, 因为 y 总是 1, 是一个常数函数 。d)
::d)y=xxx=xxSolution:
::解决方案 :is not an exponential function because is both the base and power of the exponent.
::y=xx 不是一个指数函数, 因为 x 是指数的基数和功率 。e)
::e) y=x12Solution:
::解决方案 :is not an exponential function because the base is not a constant and the exponent is not a variable.
::y=x12 不是一个指数函数,因为基数不是常数,引号也不是变量。Example 2
::例2Use a graphing utility to graph and . How are the graphs the same, and how are they different?
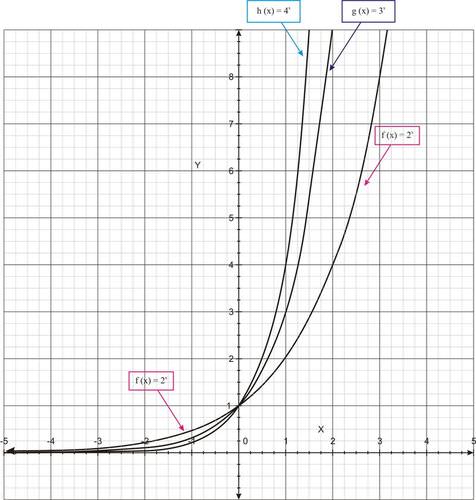
::使用图形工具来绘制f(x)=2x、g(x)=3x和h(x)=4x的图形。 图形如何相同, 以及它们有何不同 ?Solution:
::解决方案 :and are shown together below.
::f(x) = 2x, g(x) = 3x, h(x) = 4x 合并如下。The graphs of the three functions have the same overall shape: they have the same end behavior, and they all contain the point (0, 1). The difference lies in their rate of growth. Notice that for positive -values, grows the fastest and grows the slowest. The function values for are highest, and the function values for are the lowest for any given positive value of . For negative - values, the relationship changes: has the highest function values of the three functions.
::3个函数的图形具有相同的整体形状: 它们具有相同的终端行为, 它们都包含点 (0, 1) 。 差别在于它们的增长率 。 请注意, 正数的 x 值, h( x) =4x 增长最快, f( x) =2x 增长最慢 。 h( x) =4x 的函数值最高, f( x) =2x 的函数值最低, 任何给定的正数都是 x 。 对于负数的 x 值, 关系变化: f( x) =2x 的函数值最高。Example 3
::例3Use transformations to graph the functions a) and b) .
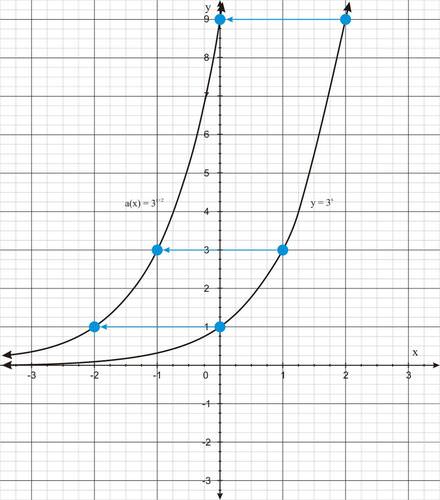
::使用变换来图解函数 a) a(x)=3x+2和b) b(x)\%3x+4。Solution:
::解决方案 :a)
::a) a(x)=3x+2This graph represents a shift of y = 3 x two units to the left. The graph below shows this relationship between the graphs of these two functions:
::此图表示 Y = 3x 2 单位向左的移动。 下图显示这两个函数的图形之间的关系 :b)
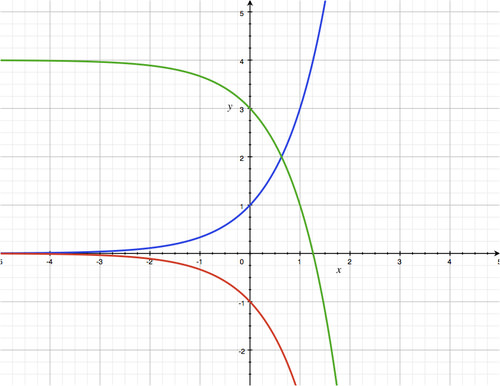
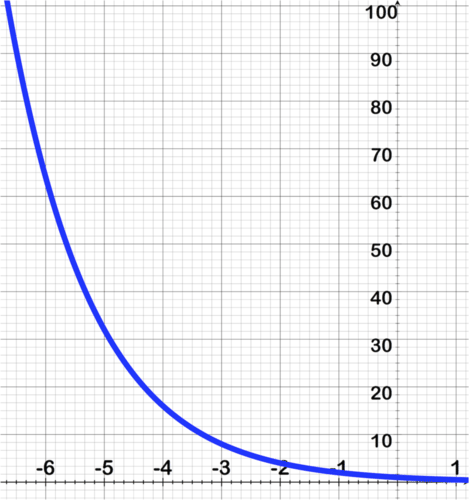
:b) b(xx) 3x+4
This graph represents a reflection over the - axis and a vertical shift of 4 units. Produce a graph of b ( x ) using three steps: sketch , reflect the graph over the x- axis, and then shift the graph up 4 units. The graph below shows this process:
::此图代表 X 轴的反射和 4 个单位的垂直移动。 使用三个步骤( 草图 y= 3x ) 绘制 b (x) 的图, 反映 x 轴上的图形, 然后将图向上移动 4 个单位。 下图显示此过程 :Example 4
::例4Recall the question from the Introduction. The king, when choosing the 2nd payment option, could not possibly have delivered the last payment. The number of grains of rice on the last square would have been almost 10 quintillion (million million million). That is more rice than is produced in the world in an entire year.
::回顾导言中的问题。 国王在选择第二位支付选择时不可能交付最后一笔支付。 最后一个广场上的稻米谷物数量本来将近10万五千(百万),这比全世界一年中生产的稻米多。Solution:
::解决方案 :grains of rice.
::P2(63)=263=9,223,372,036,854,775,808粒大米。Example 5
::例5Solve the following equations algebraically or graphically:
::以代数或图形方式解决下列方程式:a)
:Solution:
::解决方案 :Since both sides of the equation can be written as a power of the same base, use algebra to solve for :
::由于方程式的两面可以写成同一基数的力量,使用代数解析 x:
::56x+10=25x-156x+10=52(x-1)6x+10=2(2x-1)6x+10=2x-24x**12x*3b)
:Solution:
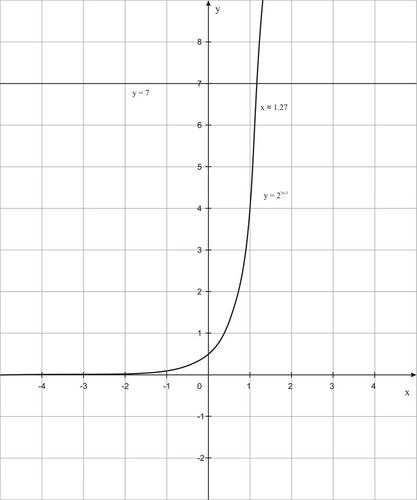
::解决方案 :Since both sides of the equation cannot be written as a power of the same base, graphically solve for . Graph the function and find the point where the graph intersects the horizontal line .
::由于方程式的两侧无法以同一基数的力量写入, x 的图形解析。 绘制函数 y= 23x- 1, 并找到图形交叉水平线 y= 7 的点 。The solution is x ≈ 1.27.
::答案是x 1.27。c)
:Solution:
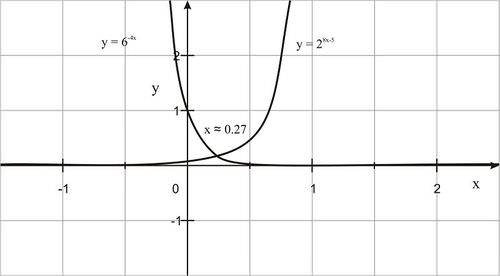
::解决方案 :Since both sides of the equations cannot be written as a power of the same base , graphically solve for . Graph the functions and and find their intersection point.
::由于方程式的两侧无法以同一基数的力量写入, x 的图形解析。 绘制 y= 6 - 4x 和 y= 28x - 5 的函数, 并找到它们的交叉点 。The solution is approximately x ≈ 0.27.
::溶液约为x 0.27。Example 6
::例6Write the exponential function that passes through the following points: .
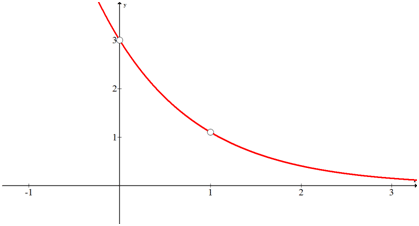
::写入通过下列点的指数函数: (0) 3,(1,3) (1,3e)。Solution:
::解决方案 :Determine the initial value. From our properties of exponential functions, we know that e very exponential function of the form will pass through the point . will always be the y-intercept of the function, or its value at . Therefore , t he initial value is .
::确定初始值。 从我们指数函数的属性中, 我们知道, y=abx 窗体的每个指数函数都会通过点 (0,a) 。 a 将始终是函数的 Y interview, 或其在 x=0 的值。 因此, 初始值是 a= 3 。 因此, 初始值是 a= 3 。Now you can find using the 2nd point.
::现在你可以用第二点找到bso that .
::f(1)=3b1=3eb=1eso f(x)=3(1e)x=3e-x。Example 7
::例7A mummified animal is found preserved on the slopes of an ice-covered mountain. After testing, a scientist measures that 75% of the initial amount of the carbon-14 sample has decayed. How long ago was this animal alive?
::在冰覆盖的山坡上发现了一种木乃伊动物。经过测试,科学家测量了碳-14样本初始量的75%已经衰减。这只动物存活了多久?Solution:
::解决方案 :Let denote the time measured in half-life units. Since , there is 0.25 of the carbon-14 remaining.
::让 x 表示以半衰期单位衡量的时间。 自 1007525%以来, 剩余碳-14为0. 25。
:Thus, . This does not mean that two years ago the animal was alive. It means that two half-lives ago the animal was alive.
::因此, x=2. 这并不意味着动物两年前还活着。 这意味着动物在两半衰期之前还活着。Since the half-life for carbon-14 is 5,730 years, Thus, to the nearest thousand, this animal died approximately 11,000 years ago.
::由于碳-14的半衰期为5,730年,5,7302=11,460。因此,到最近的1000年,这只动物大约在11000年前死亡。Summary
::摘要-
Exponential functions take the form
where
and
are constants.
::指数函数为 f(x) = abx, 其中 a0 和 b1, b>0 是常数 。 -
For
, the exponential function grows without bound as
approaches
. As
approaches
, the function values get closer and close to 0. For
these limits are reversed.
::对于 b>1, 指数函数会增长而没有被约束为 x 接近 \\\\\\\\\\\\\\\\\ x 接近 \\\\\\\\\\\\\\\\\\\\\\\\\\\\\\\\\\\\\\\\\\\\\\\\\\\\\\\\\\\\\\\\\\\\\\\\\\\\\\\\\\\\\\\\\\\\\\\\\\\\\\\\\\\\\\\\\\\\\\\\\\\\\\\\\\\\\\\\\ x \\\\\\\\\\\\\\\\\\\\\\\\\\\\\\\\\\\\\\\\\\\\\\\\\\\\\\\\\\\\\\\\\\\\\\\\\\\\\\\\\\\\\\\\\\\\\\\\\\\\\\\\\\\\\\\\\\\\\\\\\\\\\\\\\\\\\\\\\\\\\\\\\\\\\\\\\\\\\\\\\\\\\\\\\\\\\\\\\\\\\\\\\\\\\\\\\\\\\\\\\\\\\\\\\\\\\\\\\\\\\\\\\\\\\\\\\\\\\\\\\\\\\\\\\\\\\\\\\\\\\\\\\\\\\\\\\\\\\\\\\\\\\\\\\\\\\\\\\\\\\\\\\\\\\\\\\\\\\\\\\\\\\\\\\\\ -
Every exponential function of the form
will pass through the point
where
will be the
-intercept of the function or its value at
.
::y=abx 窗体的每个指数函数都会通过点 (0,a) , 其中将显示 x=0 的函数或值的 Y 界面 。 -
Exponential equations can be solved by:
-
Writing both sides as the same base to a power and equating exponents.
::将两边写成同一个基点, 写成一个力量和等同的推手。 -
G
raphing as two separate equations to determine the intersection point.
::以两个不同的方程式绘制图表,以确定交叉点。
::指数方程式可以通过以下方式解决: 将两边写成同一个基数, 并等同指数。 以两个独立的方程式绘制图表, 以确定交叉点 。 -
Writing both sides as the same base to a power and equating exponents.
-
If
, then the curve will be increasing and represent exponential growth.
::如果 b>1, 曲线将会增加, 并代表指数增长 。 -
If
, then the curve will be decreasing and represent exponential decay.
::如果 0<b<1, 曲线将会下降, 并代表指数衰减 。
Review
::回顾Write the exponential function that passes through the following points:
::写入通过下列点的指数函数:1. (0, 5) and (1, 25)
::1. (0,0,5)和(1,25)2. (0, 2) and (1, 8)
::2. (0,2)和(1,8)3. (0, 16) and (2, 144)
::3. (0,16)和(2,144)Sketch the graph of each function:
::绘制每个函数的图形 :4.
::4.y=2×3x5.
::5.y=412x6.
::6.y=212x+1+2Write an equation for each graph:
::为每个图表写一个方程式 :7.
8.
9.
Use graphing transformation rules to sketch the graph of each function:
::使用图形转换规则绘制每个函数的图形:10.
::10. f(x)=3x-411.
::11. f(x)4x12.
::12. f(x)=3x-213.
::13. f(x) 5x+214.
::14. f(x)=5x-4-315. Explain why for exponential functions of the form the -intercept is always the value of .
::15. 解释为什么y=abx的窗体的指数函数Y的截取始终是a的值。16. Suppose 40 rabbits are released on an island. The rabbits mate once every four months and produce an average of four offspring, which also produce more offspring four months later. Assume half the population is female. Estimate the number of rabbits on the island in three years if their population grows exponentially.
::16. 假设40只兔子在一个岛上被释放,兔子队每四个月生一次,平均产生四个后代,四个月后也产生更多后代,占人口的一半是女性,如果岛上的兔子人口成倍增长,估计三年内岛上的兔子数量。17. The half-life of a particular element is 2.552 minutes. How much of an 10-gram sample would be left after eight minutes?
::17. 某一元素的半衰期为2.552分钟,8分钟后将有多少10克样本留下?Review ( Answers)
::回顾(答复)Please see the Appendix.
::请参看附录。\Rightarrow x + 1 = 3 -
One million grains of rice for each square of the chessboard.