Sine 和 Consine 图形图
章节大纲
-
Introduction
::导言Now that trigonometric ratios have been established, they can be used to model cyclic behavior. Consider the set of data below. These temperatures will repeat with consistent patterns over time. The unit circle's repeating pattern helps to develop six new functions, which can be used to model periodic behavior such as this dataset.Month Jan Feb Mar Apr May Jun Jul Aug Sep Oct Nov Dec Average Temperature (F) 18 26 2 9 40 60 64 73 7 0 63 59 42 28 Graphing Sine and Cosine
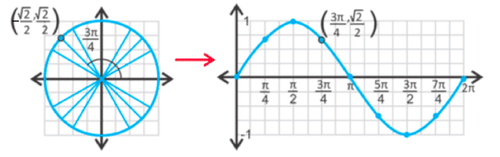
::Sine 和 Consine 图形图To graph the functions, the unit circle will be transferred in coordinate pairs (angle in radians, trigonometic ratio) to the Cartesian coordinate system . To carry out this process, the unit circle will be "unraveled."
::要绘制函数图, 单位圆将以坐标对( 以弧度为角, 三色系比) 转到笛卡尔坐标系统 。 要执行此进程, 单位圆将被“ 未绕动 ” 。Recall that for the unit circle, the coordinates are where is the central angle. To graph rewrite the coordinates as where is the central angle in radians. Below the sine coordinates for are labeled on the sine graph.
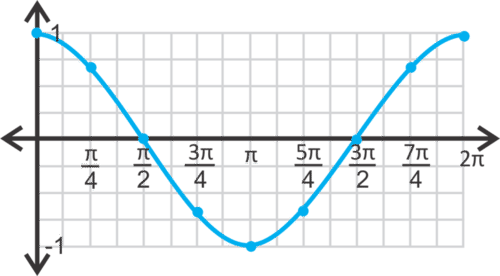
::回想单位圆的坐标是(cos,sin) , 坐标是 ° 的中心角。 要绘制 y=sinx, 请将坐标重写为 (x,sinx) , x 是弧度的中心角。 在正弦图的正弦坐标下方是 34 。Notice that the range of is . The maximum value is 1, which is at . The minimum value is -1 at . Th e value of the sine function is called the .
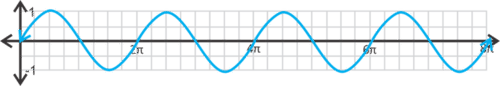
::注意 y=sinx 的范围是 [- 1,1] 。 最大值是 1 , 在 x\\ 2 。 最小值是 - 1 , 在 x= 32 。 正弦函数的值( 43, - 12) 被称为 。Now, consider the domain. Since a 2nd trip around the unit circle yields a new set of coordinate pairs with the same sine values, the initial pattern repeats. This means that the sine curve is periodic . A periodic function is one that has a predictable repeating pattern. If you look back at the unit circle, you see the sine values repeat every radians. Therefore, the curve above will repeat every units, making the period . Since it is possible to generate both positive and negative values for the angle, , the domain is all real numbers.
::现在,请考虑域。由于在单位圆周围的第二次旅行产生一组带有相同正弦值的新的坐标对,初始模式重复。这意味着正弦曲线是周期性的。一个周期函数是具有可预测的重复模式的周期函数。如果回顾单位圆,您可以看到正弦值重复每2- 平方弧度。因此,以上曲线将重复每2- 平方单位,使周期为2- 平方。由于可以生成角度的正值和负值, x,域是所有实际数字。Similarly, can be created by "unraveling" the unit circle:
::同样,y=cosx也可以通过“untraveling”单位圆来创建:Notice that the range is also between 1 and -1, and the domain will be all real numbers. The cosine curve is also periodic, with a period of .
::注意范围也介于 1 和 - 1 之间, 域将全部为真实数字。 余弦曲线也是定期的, 时间段为 2+ 。Comparing and (below), notice that the curves are almost identical, except that the sine curve starts at and the cosine curve starts at .
::比较 y=sinx 和 y=cosx (以下),请注意曲线几乎相同,但正弦曲线以y=0开始,余弦曲线以y=1开始。If the sine curve is shifted units to the left or the cosine curve the matching value to the right, then they will overlap. Any horizontal shift of a trigonometric function is called a phase shift , which is covered in another section.
::如果正弦曲线向左移% 2 单位, 或余弦曲线向右的匹配值, 它们就会重叠 。 三角函数的任何水平移动都称为相移, 由另一部分覆盖 。Amplitude
::振幅Stretching the graphs of and vertically is accomplished by multiplying the sine or cosine by , where or where is the amplitude of the curve. As noted earlier, it equals .
::将 y=sinx 和 y=cosx 的图形垂直拉伸,通过将正弦或余弦乘以一个,即 y=asinx 或 y=acosx,即 a 等于曲线的振幅。如前所述,它等于最大值 - 最小值2。Examples
::实例Example 1
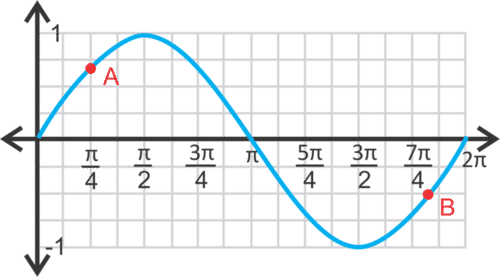
::例1Identify the highlighted points on and .
::确定y=sinx 和y=cosx 上的亮点 。Solution:
::解决方案 :For each point, think about what the sine or cosine value is at those values.
::对于每一点,请考虑一下这些值的正弦值或余弦值是什么。For point , . Therefore, the point is .
::对于A点,sin4=22。因此,要点是(%4,22)。For point , work backwards because it is not exactly on a vertical line, but on a horizontal one. When is ? When or . By looking at point ’s location, it is the 2nd option. Therefore, the point is .
::对于 B 点, 倒着工作, 因为它不完全在垂直线上, 而是在水平线上。 当sinx12 是什么? 当 x= 76 或 116 时 。 通过查看 B 点的位置, 这是第二个选项 。 因此, 点是 (116 ) - 12 。For the cosine curve, point is the same as point because the sine and cosine for is the same.
::对于余弦曲线,C点与A点相同,因为4的正弦和余弦是相同的。As for point , use the same logic as for point . When does ? When or . Looking at the location of point , we know it is the 2nd option. The point is .
::至于D点,请使用与B点相同的逻辑。当 cosx12? 当 x=23 或 43 或 43 时,我们知道这是第二个选项。 点是 (43) - 12 。Example 2
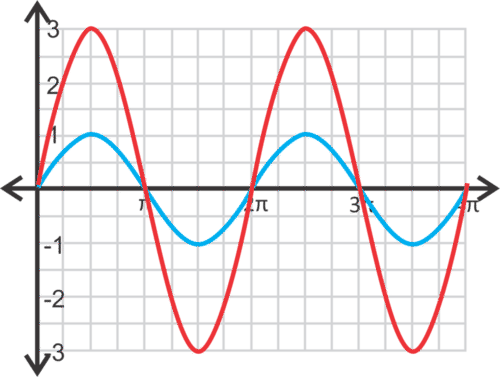
::例2Graph over two periods.
::图y=3sinx 横跨两个时期。Solution:
::解决方案 :Step 1: Start with the basic sine curve. Recall that one period of the parent graph, , is . Therefore, two periods will be .
::步骤 1: 以基本正弦曲线开始 。 回顾父形图的一个时段, y=sinx, 是 2。 因此, 两个时段将是 4 。Step 2: The 3 indicates that the range will now be from 3 to -3, and the curve will be stretched so that the maximum is 3 and the minimum is -3. The stretched red curve is .
::第2步:第3步表明,范围现在为3至3,曲线将拉伸,最大值为3,最低值为 -3。拉伸红曲线为y=3sinx。Notice that the -intercepts are the same as the parent graph. Typically, when graphing a trigonometric function, always show two full periods of the function to indicate that it does repeat.
::请注意 X 界面与父图形相同。 通常, 当绘制三角函数图时, 总是显示两个完整的函数周期, 以显示它会重复 。Example 3
::例3Graph over two periods.
::图y=12cos=x,横跨两个时期。Solution:
::解决方案 :The amplitude will be and the function will shrink rather than stretch.
::振幅将是12, 函数将缩缩而不是伸展 。Example 4
::例4Graph over two periods.
::横跨两个时期的 ysinx。Solution:
::解决方案 :The last two examples dealt with changing and was positive. Now, is negative. Just as with other functions, when the leading coefficient is negative, the function is reflected over the -axis. is in solid red, while the original function is dotted.
::后两个例子涉及修改 a 和 a 是正。 现在, a 是负的。 正如其他函数一样, 当主要系数为负时, 该函数会反映在 x 轴上 。 y sinx 以纯红色表示, 而原始函数则被点写 。Example 5
::例5Is the point on ? How can that question be answered ?
::y=sinx的要点(5+6,12)是否在y=sinx? 如何回答这个问题?Solution:
::解决方案 :Substitute in the point for and and see if the equation holds true.
::以 x 和 y 的点替代, 看看方程是否正确 。
::12=sin( 56)This is true, so is on the graph.
::这是事实,所以图上是(5-6-12)图。Example 6
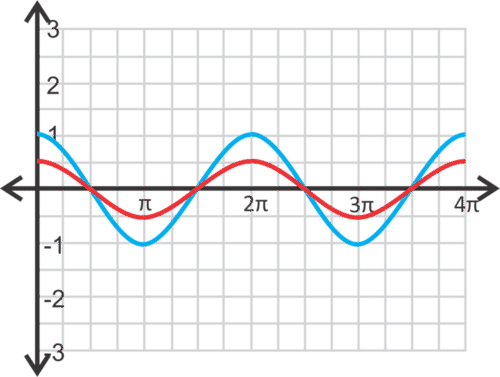
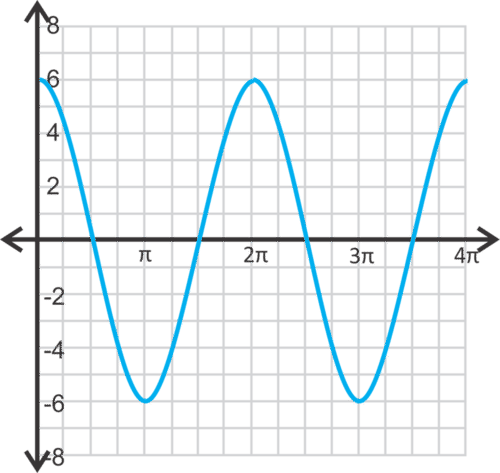
::例6Graph the following functions for two full periods:
::以下两个完整期间的函数图示 y= 6cosx。Solution:
::解决方案 :Stretch the cosine curve so that the maximum is 6 and the minimum is -6.
::伸展余弦曲线,使最大值为6,最低值为-6。Example 7
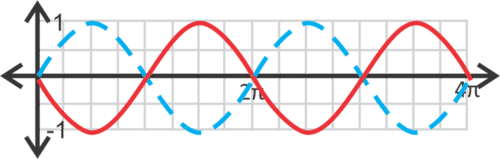
::例7Graph the following functions for two full periods: .
::以下两个完整期间的函数图解 y3cosx。Solution:
::解决方案 :The graph is reflected over the -axis and stretched so that the amplitude is 3.
::该图在 X 轴上方反射,并拉伸,使振幅为 3。Example 8
::例8Graph the following functions for two full periods: .
::以下两个完整期间的函数图示 y= 32sinx。Solution:
::解决方案 :The amplitude is .
::振幅是32。Summary
::摘要-
A number of key values, such as the starting point, the period, and the amplitude, are necessary when graphing trigonometric functions.
::在绘制三角函数图时,需要若干关键值,如起点、周期和振幅。 -
T
he behavior of the sine and cosine functions at the origin will allow you to know where to start graphing.
::正弦和余弦函数在源代码上的行为将允许您知道从何处开始图形绘制。 -
In general, graphs can be interpreted and graphed using the general formulas
and
The height of the graph is designated by the amplitude
.
::一般而言,图表可以用一般公式y=asinx和y=acosx来解释和绘制图表。图表的高度由振幅 a指定。 -
Graph of
::y=sinx 图形 -
Graph of
::y=cosx 图形
Review
::回顾-
Determine the exact value of each point on
or
.
::确定 y=sinx 或 y=cosx 上的每个点的准确值 。
-
List all the points in the interval
where
. Use the graph from 1 above to help you.
::列出 sinx=cosx 的间距 [0,4] 中的所有点。 使用上面 1 的图表来帮助您 。 -
Draw
on
. Find
and
. Plot these values on the curve.
::在 [ 0, 2] 上绘制 y=sinx。 查找 f( 3) 和 f( 53) 。 在曲线上绘制这些值 。
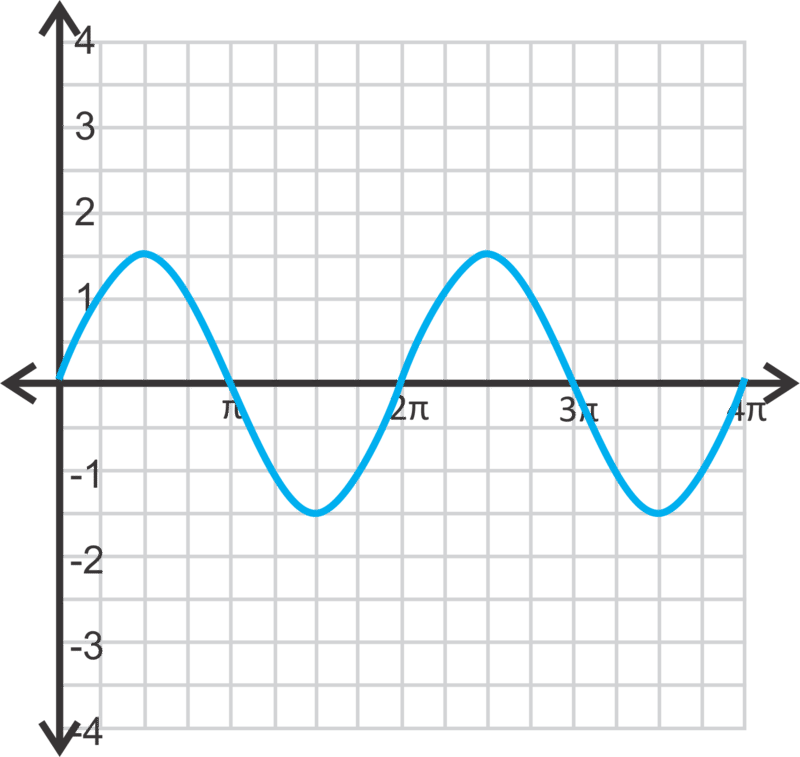
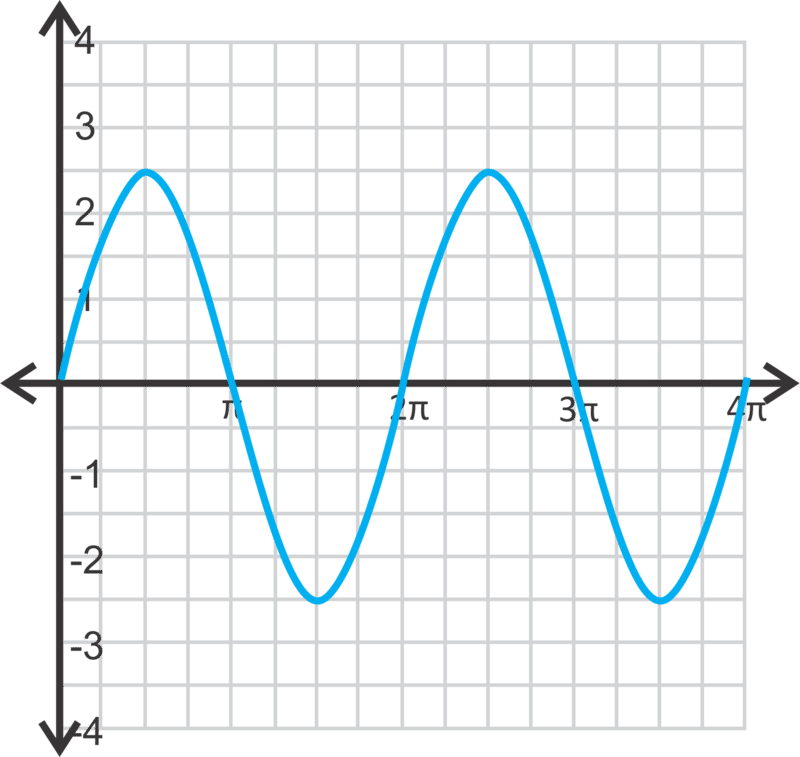
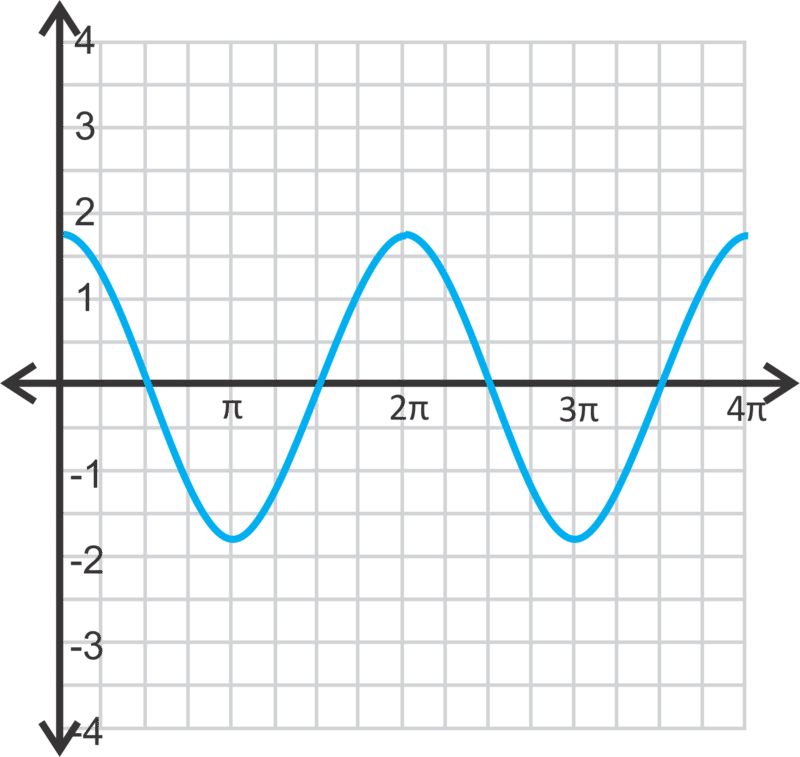
For questions 4-12, graph the sine or cosine curve over two periods.
::对于问题4-12,请用图形显示两个时期的正弦或余弦曲线。-
::y=2sinx -
::y 5cos x y 5cosx y 5cosx -
::y=14cosx -
::y y 23sin x y 23sin_x -
::y=4sinx -
::y$1.5cosx( y$1.5cosx) -
::y=53cosx -
::y=10sinx -
::y7.2sinx -
Graph
and
on the same set of axes. How many units would you have to shift the sine curve (to the left or right) so that it perfectly overlaps the cosine curve?
::图形 y=sinx 和 y=cosx 在同一组轴上。 您需要将正弦曲线( 向左或向右) 移动多少个单位才能完全重合余弦曲线 ? -
Graph
and
on the same set of axes. How many units would you have to shift the sine curve (to the left or right) so that it perfectly overlaps
?
::相同轴上的 y=sinx 和 ycosx 图形。 您需要将正弦曲线( 向左或向右) 移动多少个单位才能完全重合 ycosx ?
Write the equation for each sine or cosine curve below. for both questions.
::为下方的正弦或余弦曲线写出方程。 a>0 为两个问题写出方程。Review (Answers)
::回顾(答复)Please see the Appendix.
::请参看附录。 -
A number of key values, such as the starting point, the period, and the amplitude, are necessary when graphing trigonometric functions.