其他三角函数图
Section outline
-
Introduction
::导言
The rotating light on the front of an ambulance can be modeled by the following formula: The 16 represents the 16 feet from an object it is casting light on, and represents the distance of the beam from a point after seconds. What would the graph of this function look like?
::救护车前方的旋转灯光可以用以下公式模拟: d=16tan(1.5t) 。 16 代表着它所照亮的物体的16英尺, d 代表着波束与秒后某一点的距离。 此函数的图象是什么 ?K n owing the relationship between the equation and graph of functions, we can find the other four functions (tangent, cotangent , secant, and cosecant) by identifying zeros, asymptotes, and key points.
::了解方程式和函数图之间的关系,我们可以通过识别零、零和关键点来找到其他四个函数(切、切、切、切、切、切、切、切) 。Graphing Cosecant and Secant Functions
::Cosescant 和 secant 函数图Recall that cosecant is the reciprocal of the sine function, and secant is the reciprocal of the cosine function. Thus, their graphs are very closely related.
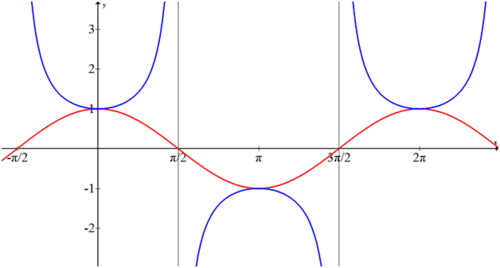
::提醒人们注意,共生函数是正弦函数的对等,分离函数是共生函数的对等。 因此,它们的图表是密切相关的。For instance, when the cosine function is equal to 0, the secant graph has a vertical asymptote. When , then as well. Also, the period will be the same for both functions' graphs, . The cosine function is the continuous red graph and the secant function is the blue one with vertical asymptotes wherever the cosine function equals 0.
::例如,当余弦函数等于 0 时, 秒图有一个垂直的静脉图。 当 cosx=1 时, 秒x=1 和 secx=1 。 另外, 两个函数的图形的周期相同, 2。 余弦函数是连续的红色图, 秒数函数是蓝色的, 只要余弦函数等于 0 , 则垂直的静脉图函数是蓝色的 。We can utilize this technique of graphing by using the reciprocal relationship to graph the cosecant function as well.
::我们可以使用这种图解技术 利用对等关系 来图解余生功能Graphing the Tangent Function
::绘制 Tangent 函数图Graphing the tangent function is more difficult than graphing the sine and cosine functions, because the tangent is composed of a ratio of the sine and cosine functions.
::相切函数的图形比正弦函数和正弦函数的图形困难,因为正弦函数和正弦函数的比重构成正弦函数和正弦函数的正弦函数。
::tanx=sinxcosxxTo graph the tangent function, first determine its asymptotes. When the cosine function is equal to 0, the tangent graph has a vertical asymptote. This happens when at .
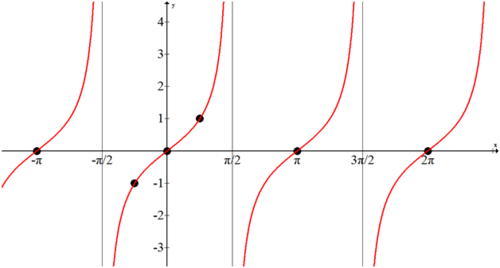
::要绘制正切函数图, 请先确定它的零位数 。 当余弦函数等于 0 时, 相切图形有一个垂直的淡点数 。 当 cosx=0 时, 就会发生这种情况 。Next, plot the zeros or -intercepts of the tangent function. This occurs when the numerator, , is equal to 0, which happens at .
::接下来,绘制正切函数的零或 x 截取点。 当分子sinx 等于 0 时, 发生于 0, , , , , , ,...Also, note from the unit circle that and .
::还有,单位圆的注意,Tan4=1 和tan(4)1。By plotting all this information, the graph of tangent can be sketched:
::通过绘制所有这些信息, 相切图可以绘制为草图 :Notice that the period of tangent is not , because it has a shorter cycle before it repeats.
::请注意,相切期间是_________年,而不是2_____年,因为它在重复之前的周期较短。Graphing the Cotangent Function
::绘制余切函数图Recall that cotangent is the reciprocal of the tangent function. Thus, their graphs are very closely related. W hen the tangent function is equal to 0, the cotangent graph has a vertical asymptote. When the tangent graph has a vertical asymptote, the cotangent function is equal to 0. Also, the period will be the same for both functions' graphs,
::提醒注意正切函数是正切函数的对等值。 因此, 它们的图形是密切相关的。 当正切函数等于 0 时, 正切图形有一个垂直的零点。 当正切图形有一个垂直的无点时, 共切函数等于 0 。 另外, 两个函数的图形的时段都是一样的 。Examples
::实例Example 1
::例1Graph
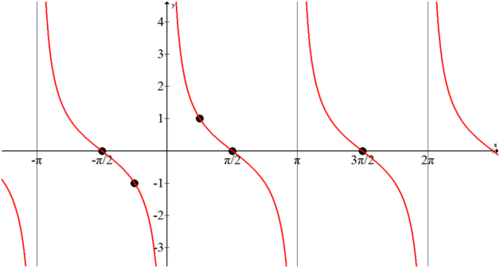
::图f(x)=cotx。Solution:
::解决方案 :Since , the graph of cotangent will have zeros wherever tangent has asymptotes, and asymptotes wherever tangent has zeros. Where tangent is 1, cotangent is also 1.
::自cotx=1tanx以来,正切值图中凡有正切值的,均切值为零的,正切值为零的,正切值为零的,正切值为1的,正切值为1的,正切值为1的。
Example 2
::例2Graph the function
::函数 f( x)\\\\\\\\\\\\\\\\\\\\\\\\\\\\\\\\\\\\\\\\\\\\\\\\\\\\\\\\\\\\\\\\\\\\\\\\\\\\\\\\\\\\\\\\\\\\\\\\\\\\\\\\\\\\\\\\\\\\\\\\\\\\\\\\\\\\\\\\\\\\\\\\\\\\\\\\\\\\\\\\\\\\\1\1\\\1\1\1\1\1\1\1\1\1\\\\\\\\\\\\\\\F\\\\F\\\\\\\\\\\\\\\\\\\\\\\\\\\\\\\\\\\\\\\\\\\Solution:
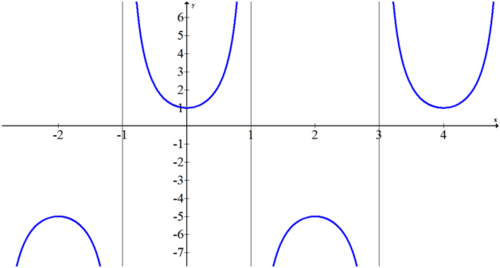
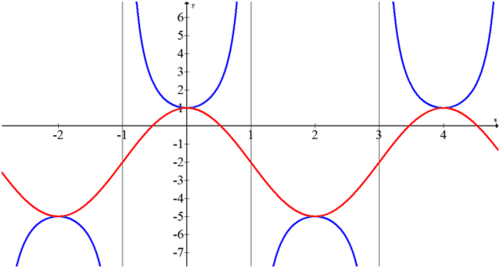
::解决方案 :Step 1: Graph the function as if it were a sine function. Then insert asymptotes wherever the sine function crosses the sinusoidal axis . Lastly, add in the cosecant curves.
::第1步:将函数像正弦函数一样图形化。然后在正弦函数穿过正弦轴的位置插入正弦函数。最后,在余弦曲线中添加。Step 2: The is 2. The shape is a reflected sine curve.
::步骤2:是2. 形状是一个反映正弦曲线。Step 3: The function is shifted up 1 unit and to the right 1 unit.
::第3步:该职能向上调1个单位和向右移1个单位。Step 4: The period is .
::第4步:该时期为22。
Note that continuous red graph is not part of the given function but a guideline to help you draw the graph.
::请注意,连续的红图不是给定函数的一部分,而是帮助您绘制图的指南。Example 3
::例3How can the cotangent function be expressed as a set of transformations applied to the tangent function ?
::如何将余切函数表述为适用于正切函数 f(x) =tanx 的一组变换?Solution:
::解决方案 :Step 1: Start by reflecting across the or the axis.
::第1步:通过反射 X 或 Y 轴开始。Step 2: Shift the function to the right or left by .
::第2步:将函数向右或左移到% 2 。Step 3: .
::第3步:f(x)=tanxcot(x)2。Example 4
::例4Return to the Introduction problem: What would the graph of look like?
::回到引言问题: d=16tan(1.5t) 的图象是什么?Solution:
::解决方案 :
Example 5
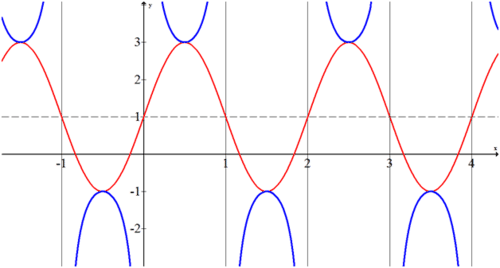
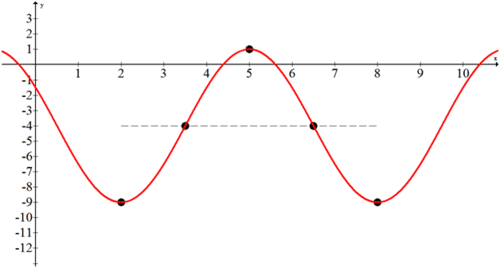
::例5Find the equation of the function in the following graph:
::在下图中查找函数的方程式:
Solution:
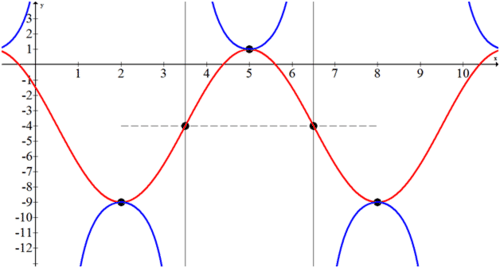
::解决方案 :Connecting the relative maximums and minimums of the function produces a shifted cosine curve that is easier to work with.
::将函数的相对最大值和最小值连接起来,可产生一个较容易使用的转动余弦曲线。Step 1: Identify the amplitude. The amplitude is 3.
::第1步:确定振幅。振幅为3。Step 2: Identify the vertical shift . The vertical shift is 2 down.
::第2步:确定垂直转换。垂直转换为向下 2 。Step 3: The period is 4, which implies that .
::第3步:期限为4年,这意味着b2。Step 4: Identify the shape. The shape is positive cosine. At , there is no phase shift to the standard cosine function.
::步骤 4 : 识别形状。 形状为正余弦。 在 x=0 时, 没有向标准余弦函数的相向转移 。Step 5: Insert all information into the general formula:
::第5步:在一般公式中插入所有信息:f(x)=3sec(%2x)-2。Example 6
::例6Graph the function
::函数 f( x)\\\\\\\\\\\\\\\\\\\\\\\\\\\\\\\\\\\\\\\\\\\\\\\\\\\\\\\\\\\\\\\\\\\\\\\\\\\\\\\\\\\\F\\\\\\\\\\\\\F\\\\\\\\\\\\\\\\\\\\\\\\\\\\\\4。Solution:
::解决方案 :Step 1: G raph the function as if it were a cosine. The vertical shift is -4. The horizontal shift is to the right 2. This gives a starting point for one period. Since the period must be 6. The amplitude is 5.
::第1步 1: 将函数显示为余弦 。 垂直移动为 - 4。 水平移动为右转 2 。 这给出了一个周期的起点 。 由于 b3 , 周期必须是 6 。 振幅是 5 。Step 2: Add in the asymptotes and secant curves. Note that the solution does not include the continuous red cosine curve.
::第2步:在小数点和松点曲线中添加。请注意,解决方案不包括连续的红余弦曲线。
Example 7
::例7Where are the asymptotes for tangent, and why do they occur?
::相切值的微粒在哪里? 为什么会发生呢?Solution:
::解决方案 :Since the asymptotes occur whenever which is
::自Tanx=sinxcosxxx, 当 csx=0, 就是2, 32, 时, 就会发生小数数 。Summary
::摘要-
Since
cosecant is the reciprocal of the sine function, and secant is the reciprocal of the cosine function, t
he secant and cosecant graphs can be sketched by sketching a faint sine or cosine graph, and using that graph to establish asymptotes.
::由于共生体是正弦函数的对等函数,分离是余弦函数的对等函数,分离和共生体图形可以通过绘制一个微弱正弦或正弦图形,并用该图来建立静脉图来绘制草图。 -
The tangent and cotangent functions are
composed of a
ratio of the sine and cosine functions,
, so their graphs can be sketched using knowledge of the sine and cosine functions.
::相切和相切函数由正弦函数和正弦函数、 tanx=sinxcosíxx和cotx=cosxinxx组成的比例组成,因此它们的图表可以使用正弦函数和正弦函数的知识绘制。 -
To graph the tangent and cotangent functions, determine the asymptotes and zeros of the functions.
::要绘制正切和余切函数图,请确定函数的零和零。
Review
::回顾1. What function can you use to help you make a sketch of ? Why?
::1. 您可以用什么函数来帮助您绘制 f( x) =secx 的草图? 为什么?2. What function can you use to help you make a sketch of ? Why?
::2. 您可以用什么函数来帮助您绘制 g( x) = csc* x 的草图? 为什么?Make a sketch of each of the following from memory:
::从记忆中绘制以下各点的草图:3.
::3. f(x) =secx4.
::4. g(x)=cscx5.
::5. h(x)=tanx6.
::6. k(x) =cotxGraph each of the following:
::每一图如下:7.
::7. f(x)=2csc(x)+18.
::8. g(x)=2csc ( 2x)+19.
::9. h(x) = 2csc (%2(x-3))+110.
::10. j(x)=cot( 2x)+311.
::11. k( x) sec( 3( x+1))- 412.
::12. (x) (x)+113.
::13. p(x) 2tan (x) 2+114. Find two ways to write in terms of other trigonometric functions.
::14. 找到两种方法,用其他三角函数来写cex。15. Find two ways to write in terms of other trigonometric functions.
::15. 找到两种方法用其他三角函数来写cscx。Review (Answers)
::回顾(答复)Please see the Appendix.
::请参看附录。 -
Since
cosecant is the reciprocal of the sine function, and secant is the reciprocal of the cosine function, t
he secant and cosecant graphs can be sketched by sketching a faint sine or cosine graph, and using that graph to establish asymptotes.