答复 -- -- 第14章:概率和统计
章节大纲
-
Section 14.2: Counting with Permutations and Combinations
::第14.2节:计算变动和合并- 840
- 122,391,522
- 132,600
- 84
- 32,760
-
Permutation/decision chart;
41
⋅
40
⋅
39
=
63
,
960
::变异/决定图; 414039=63,960 -
Combination;
5
C
2
=
10
::组合; 5C2=10 -
Permutation/decision chart;
4
⋅
3
⋅
2
=
24
::变化/决定图;432=24 -
Combination;
12
C
3
=
220
::组合; 12C3=220 -
Permutation/decision chart;
14
⋅
13
⋅
12
=
2
,
184
::变异/决定图;14/1312=2,184 -
Combination;
10
C
3
=
120
::组合; 10C3=120 -
Combination;
12
C
4
=
495
::组合; 12C4=495 -
Permutation/decision chart;
12
⋅
11
⋅
10
⋅
9
⋅
8
=
95
,
040
::变化/决定图;121110_10_9_8=95,040 -
This problem is more complicated because you are allowed to repeat. It is like a combination problem (because order does not matter) where you are allowed to repeat.
::这个问题比较复杂, 因为您可以重复。 它就像一个组合问题( 因为顺序无关紧要 ) , 您可以重复 。 -
Students should feel confident using the graphing calculator for permutations and combinations.
::学生应该有信心使用图形计算器来计算变异和组合。
Section 14.3: Binomial Theorem
::第14.3节:二子论理-
x
4
−
4
x
3
y
+
6
x
2
y
2
−
4
x
y
3
+
y
4
::x4 - 4x3y+6x2y2 - 4x3+y4 -
x
5
−
15
x
4
y
+
90
x
3
y
2
−
270
x
2
y
3
+
405
x
y
4
−
243
y
5
::x5-15x4y+90x3y2-270x2y3+405xy4-243y5 -
128
x
7
+
1
,
792
x
6
y
+
10
,
752
x
5
y
2
+
35
,
840
x
4
y
3
+
71
,
680
x
3
y
4
+
86
,
016
x
2
y
5
+
57
,
344
x
y
6
+
16
,
384
y
7
::128x7+1,792x6y+10,752x5y2+35,840x4y3+71,680x3y4+86,016x2y5+57,344xy6+16,384y7 - -280
- 56
- -960
- 2,400
- 112
- 70,000
- 512
- 4,096
- 256
-
(
3
x
−
1
)
5
:3x-1)5
-
(
x
−
y
)
7
: -
(
2
x
−
y
)
7
:
Section 14.4: Basic Probability
::第14.4节:基本概率- 1 13
- 16 52 = 4 13
-
::应该有8个总结果:HH、HHT、HTH、HTT、HHT、TH、THT、TTT、TTTT。 -
::有10,240种方式可以连续拥有5张牌,但其中40种方式是直冲或王室冲洗。因此,只有10,200种方式是真正的冲洗。有52C5=2,598,960的扑克手总数。概率为10,2002,598,960=0.392%。
::第14.5节:预期价值和收益-
To calculate expected value, multiply the value of each outcome by the probability of that outcome and find the sum of all these products.
::为了计算预期值,将每种结果的值乘以该结果的概率,并找到所有这些产品的总和。 -
False. $0.50 is your expected average amount of winnings if you were to play the game many times.
::假的。 $0. 50是您预期的平均赢额 如果你玩了多次游戏的话。 -
True
::真实 -
1
6
or 17 cents
::16或17美分 -
36 cents
::36美分 -
They should charge people more than 65 cents (the expected value) to play.
::他们应该向人们收取超过65美分(预期价值)的游戏费用。 - 18.02
- 81.3%
- 70.5%
- 93.0%
- 79.5%
- 76.3%
-
Answers vary.
::答案不尽相同。 -
You should charge more than the $1.15 to theoretically make a profit by the end of the night.
::理论上来说,你应该花费超过1.15美元 来在晚上前赚钱。 -
Answers vary.
::答案不尽相同。 -
Casinos need to design games that people have a chance of winning, but which ultimately enable the casino to make money. Expected value helps determine what their profit will be on average for each game, and can help them determine what should be charged for each game.
::赌场需要设计人们有机会赢得但最终能使赌场赚钱的游戏。 预期价值有助于确定每场比赛的平均利润,并帮助他们决定每场比赛应收取什么费用。
Section 14.6: Graphic Displays of Data
::第14.6节:数据图示-
-
-
Answers will vary.
::答案将各有不同。 -
-
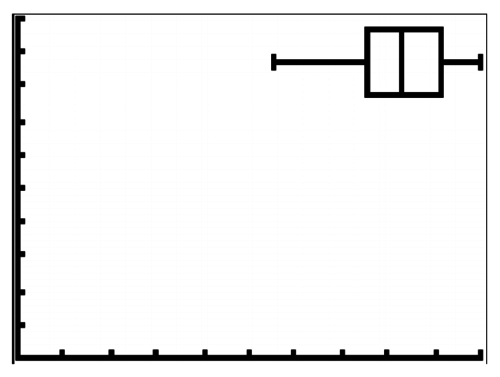
- {55, 75, 82.5, 91.5, 100}
-
-
Answers vary. A student might notice there is a bigger range in the 1st half of the data than in the 2nd half of the data.
::答案各有不同。学生可能会注意到,在数据第1半中,数据的范围比数据第2半中的范围更大。 -
Answers vary. A student might notice that more of the data is in the left side of the graph than in the right side of the graph.
::答案不尽相同。学生可能会注意到,图左侧的数据多于图右侧的数据。 -
-
-
Answers vary.
::答案不尽相同。 -
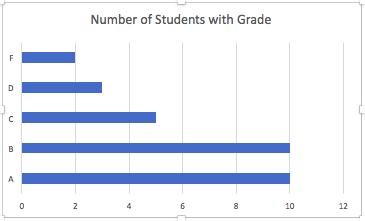
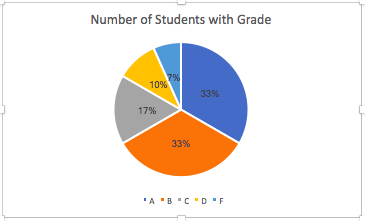
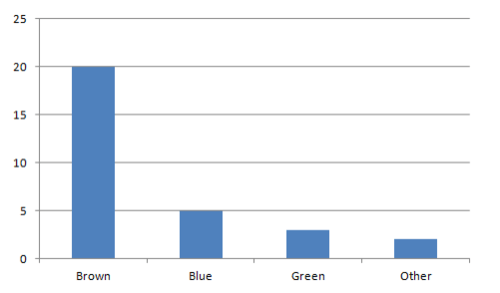
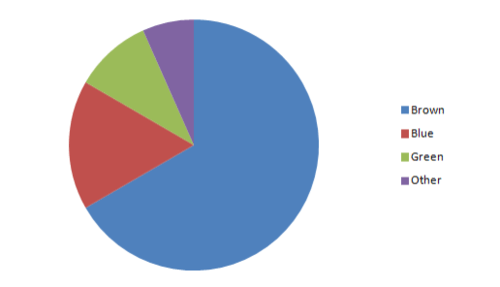
Bar graph or pie chart
::条形图表或饼图表 -
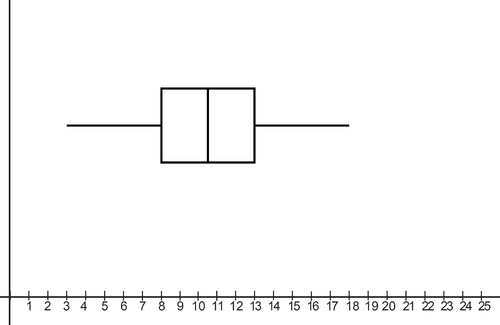
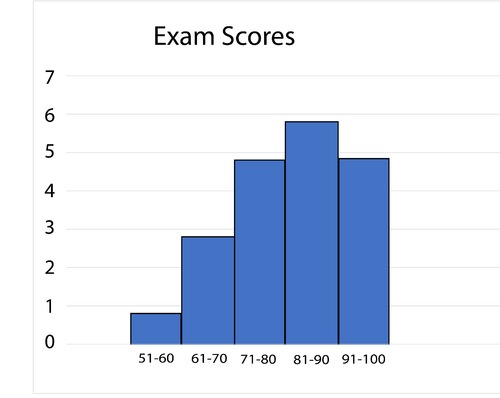
Histograph or boxplot
::历史图或盒式图 -
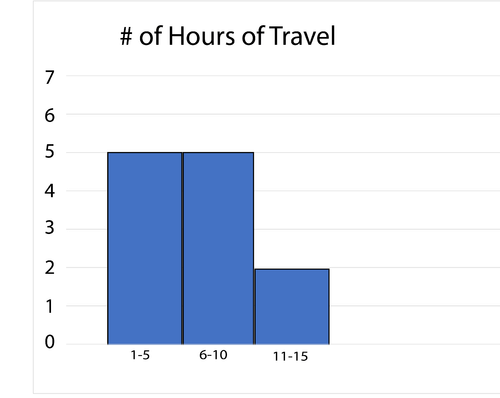
Interval Frequency 1-5 5 6-10 5 11-15 2
::中间频率 1-5 5 6-10 5 11-15 2 -
-
Answers will vary.
::答案将各有不同。 -
Answers will vary.
::答案将各有不同。
Section 14.7: Mean, Median, and Mode
::第14.7节:平均值、中位数和方式-
Mean: 1.76; Median: 1; Mode: 1
::平均值: 1.76; 中中:1; 模式:1 -
Because there are two large numbers at the end that contribute more heavily to the mean, but don't impact the median.
::因为最后有两个大的数字 更能推动中值, 但不会影响中位数。 -
The median or mode would make the most sense in this case, because they are not impacted by the outliers of 10 siblings. Also, you can't have 1.76 siblings, so 1.76 siblings would not make sense as the "typical number of siblings."
::在这种情况下,中位数或模式最有意义,因为它们没有受到10个兄弟姐妹外缘的影响。 另外,你不能有1.76个兄弟姐妹,因此1.76个兄弟姐妹不会像“典型的兄弟姐妹人数”那样有意义。 - 885
- 16
-
154 miles
::154英里 - 5
-
Mean: 19.2; Median: 19; Mode: 15
::平均值:19.2;中中:19;模式:15 -
Mean: 7.083; Median: 6; Mode: 5
::平均值: 7.083; 中中: 6; 模式: 5 -
Mean: 3.889; Median: 4; Mode: none
::平均值:3.889;中中:4;模式:无 -
Mean: 69.75; Median: 88.5
::平均值:69.75;中位数:88.5 -
Mean: 31.67; Median: 19.5
::平均值:31.67;中位数:19.5 -
Number 12, because there was one number much larger than the rest in the data.
::12号,因为有一个数字比数据中的其他数字大得多。 -
Number 11, because there was one number much smaller than the rest in the data.
::11号,因为有一个数字 大大小于数据中的其余部分。 -
In Number 11,
the outlier is
12. In Number 12, the outlier is
98
. If you were to remove the outliers, the mean would be closer to the median in each case.
::在11号中,出口值是12号,在12号中,出口值是98号,如果你删除出口值,平均值将接近每个案例的中位数。
Section 14.8: Five-Number Summary
::第14.8节:五份摘要-
Minimum: 0.08
Q1: 0.18
Q2: 0.235
Q3: 0.27
Maximum: 0.32
::最低值: 0.08 Q1: 0.18 Q2: 0.235 Q3: 0.27 最大值: 0.32 -
Minimum: 77
Q1: 79.5
Q2: 86.5
Q3: 90.5
Maximum: 99
::最低值:77 Q1:79.5 Q2:86.5 Q3:90.5 最大值:99 -
Minimum: 53
Q1: 79.5
Q2: 84.5
Q3: 92
Maximum: 98
::最低值:53 Q1: 79.5 Q2: 8.4.5 Q3: 92 最大值: 98 -
Minimum: 51
Q1: 72
Q2: 85
Q3: 91
Maximum: 96
::最低值:51 Q1: 72 Q2: 85 Q3: 91 最大值: 96 -
Minimum: 185
Q1: 220.5
Q2: 281
Q3: 363.5
Maximum: 518
::最低值: 185 Q1: 220.5 Q2: 281 Q3: 363.5 最大值: 518 -
Minimum: 33
Q1: 38
Q2: 40
Q3: 48.5
Maximum: 71
::最低值:33 Q1:38 Q1:38 Q2:40 Q3:48.5 最大值:71 -
Minimum: 3
Q1: 6
Q2: 12
Q3: 16
Maximum: 21
::最低值: 3 Q1: 6 Q2: 12 Q3: 16 最大值: 21 -
Minimum: 6
Q1: 16.5
Q2: 26
Q3: 37
Maximum: 49
::最低值: 6 Q1: 16.5 Q2: 26 Q3: 37 最大值: 49 -
Minimum: 5
Q1: 9
Q2: 10.5
Q3:12
Maximum: 17
::最低值: 5 Q1: 9 Q2: 10.5 Q3:12 最大值: 17 -
Minimum: 49
Q1: 50
Q2: 53
Q3: 57
Maximum: 67
::最低值: 49 Q1: 50 Q1: 50 Q2: 53 Q3: 57 最大值: 67 -
Minimum: 5
Q1: 18.5
Q2: 20.5
Q3: 22.5
Maximum: 24
::最低值: 5 Q1: 18.5 Q2: 20.5 Q3: 22.5 最大值: 24 -
Minimum: 620
Q1: 800
Q2: 850
Q3: 900
Maximum: 1,070
::最低值:620 Q1:800 Q1:850 Q3:900 最大值:1 070 -
Minimum: 12
Q1: 13.5
Q2: 17
Q3: 22.5
Maximum: 42
::最低值:12 Q1: 13.5 Q2: 17 Q3: 22.5 最大值: 42 -
Minimum: 15
Q1: 17.5
Q2: 21
Q3: 32.5
Maximum: 55
::最低值: 15 Q1: 17.5 Q2: 21 Q3: 32.5 最大值: 55 -
Minimum: 120
Q1: 122
Q2: 124.5
Q3: 129
Maximum: 149
::最低值:120 Q1:122 Q2:124.5 Q3:129 最大值:149
Section 14.9: Variance
::第14.9节:差异-
Standard deviation and variance are both measures of spread, but variance is a larger number. Standard deviation is the square root of variance.
::标准偏差和差异是分布的衡量标准,但差异较大,标准偏差是差异的平方根。 -
Dataset A has data that is more varied and spread out than the data in Dataset B.
::数据集 A 拥有的数据比数据集 B 中的数据更加多样和分散。 - 33.2967
- 16.5432
- 254.568
- 33.2967
- 16.5432
- 254.568
- 4
-
c
::c , c , c , c -
If variance is large, data will be spread out on a histogram. There might be a lot of data at low values and a lot of data at high values, with not much in between. If variance is small, all data will be close together near the mean.
::如果差异很大, 则数据将分布在直方图上。 可能有很多低值数据和高值数据, 中间数据不多。 如果差异小, 所有数据将接近平均值 。 -
No, you can only calculate the variance for quantitative data, not categorical data. Bar graphs only show categorical data.
::不,您只能计算定量数据的差异,而不是绝对数据。巴图只显示绝对数据。 -
Mean: 81.5; Sample Variance: 149.105; Sample Standard Deviation: 12.2109
::平均数:81.5;抽样差异:149.105;标准偏离抽样:12.2109 -
Mean: 5.15; Population Variance: 12.0275; Population Standard Deviation: 3.46807
::平均数:5.15;人口差异:12.0275;人口标准偏离:3.46807 -
It is often not realistic or possible to find data from the whole population, and then you have to be satisfied with having
only
a sample of the population. For example, it would be impossible to find a piece of information from every person in the world, but you might be able to get data samples from every country.
::从整个人口中找到数据往往既不现实也不可行,然后你必须满足于只拥有一个人口样本。 比如,不可能从世界上每个人那里找到一小块信息,但你也许能够获得每个国家的数据样本。
Section 14.10: The Normal Curve
::第14.10节:正常曲线- 0
- 1
- 84.13%
- 15.87%
- 2.28%
- 95.45%
- 64.69%
- 0
- 90.31%
- 1.16%
-
1.64 standard deviations below the mean.
::1.64 低于平均值的标准差。 - 49.38%
-
Approximately 68% of adult women are between 63 and 67 inches tall.
::大约68%的成年妇女身高在63至67英寸之间。 - 69.15%
- 0.644%
Section 14.11: Linear Correlation
::第14.11节:线性关联-
Negative
::负 -
No correlation
::无相关性 -
Positive
::阳 -
Very strong positive correlation. The data is perfectly linear with a positive slope. As the value of one variable increases, the value of the other variable increases.
::非常强烈的正正相关关系。数据完全线性,有正斜坡。随着一个变量的值增加,另一个变量的值增加。 -
Mild negative correlation. The data is somewhat linear with a negative slope. As the value of one variable increases, the value of the other variable tends to decrease.
::最小负相关关系。 数据有些线性,有负斜度。 随着一个变量的值增加,另一个变量的值往往会下降。 -
Very strong negative correlation. The data is perfectly linear with a negative slope. As the value of one variable increases, the value of the other variable decreases.
::非常强烈的负相关关系。数据完全线性,有负斜度。随着一个变量的值增加,另一个变量的值减少。 -
No correlation. There is no relationship between the two variables. As the value of one variable increases, there is no pattern to what happens to the value of the other variable.
::没有相关关系。 两个变量之间没有关系。 由于一个变量的值增加, 另一个变量的值没有变化模式。 -
Strong positive correlation. The data is strongly linear with a positive slope. As the value of one variable increases, the value of the other variable increases.
::数据线性强,斜坡正。随着一个变量的值增加,另一个变量的值增加。 -
ˆ
y
=
0.0974125588
+
0.005546124
x
;
r
=
0.94668
::y=0.09741255888+0.005546124x;r=0.94668 -
2.87. This seems to fit with the data.
::2.87. 这似乎与数据相符。 -
No. Just because the two variables are correlated doesn't mean that a high SAT score would
cause
a high GPA.
::不,仅仅因为这两个变量是相互关联的, 并不意味着高SAT分数 会导致高GPA。 -
ˆ
y
=
9.1513
x
+
168.692
;
r
=
0.98082
::y=9.1513x+168.692;r=0.98082 - $425
-
Answers vary.
::答案不尽相同。 -
ˆ
y
=
5659.45
−
90
x
;
r
=
-
0.8491
::y=565945-90x;r=-0.8491 - 4,579
-
Answers vary.
::答案不尽相同。 -
Answers vary. Possible answer: The correlation coefficient measures how strong the correlation is between two variables and whether the correlation is positive or negative.
::答案不尽相同。可能的答案是:相关系数衡量两个变数之间的相关性有多强,以及相关性是正的还是负的。 -
Answers vary. Possible answer: If you have a larger sample size, you will have more data points and will be closer to having data from the full population.
::答案不尽相同。 可能的答案是: 如果您的样本大小较大, 您将会有更多的数据点, 并且更接近于获得来自全部人口的数据 。
Section 14.12: Modeling with Regression
::第14.12节:以倒退为模式-
Two good choices are natural log regression and logistic regression. With natural log regression, the equation is
ˆ
y
=
11.4146888
l
n
(
x
)
+
27.61585
,
and with logistic regression, the equation is
ˆ
y
=
65.8877
1
+
1.422
e
−
.210439
.
::两种好的选择是自然日志回归和物流回归。随着自然日志回归,方程式为 y= 11.41466888(x)+27.61585,而物流回归为 y=65.88771+1.422e-210439。 -
The logistic function is a better fit because it levels off as the height of the women levels off.
::后勤职能更适合,因为随着妇女高度的升高,后勤职能会稳定下来。 -
The natural log regression does not have a
y
-intercept, and the logistic equation has a
y
-intercept as 26.7. This would be the height of a baby when it was born. The typical length of a baby at birth is 20 inches, so the model is a bit unreasonable.
::自然记录回归没有 Y 界面, 逻辑方程式的 Y 界面为 26. 7 。 这将是婴儿出生时的高度。 婴儿出生时的典型长度为 20 英寸, 因此模型有点不合理 。 -
With the logistic equation, the predicted height is 64.88768 inches. This is reasonable because women aren't growing anymore when they are 70. To be perfectly realistic, the model should level off for awhile in the middle and then start to decrease, as women tend to actually slowly lose height as they get older, after about age 40.
::在后勤等式中,预计身高为64.88768英寸,这是合理的,因为女性在70岁时不再成长了,因此,如果完全现实的话,模型应该在中间保持一段时间,然后开始下降,因为女性在40岁以后,随着年龄的增长,其身高实际上会慢慢下降。 -
The equation is
ˆ
y
=
58.9
⋅
0.514
x
.
::方程式是 y=58.90.514x -
Exponential regression makes sense because she is losing approximately half her height with each sip. This is exponential decay with a common ratio of
1
2
.
::指数回归是有道理的,因为她每口口水都会失去大约一半的高度。这是指数衰减,共同比率为12。 -
About 5 sips.
::大约五口。 -
1.0867 inches.
::1.0867英寸。 -
The equation is
ˆ
y
=
385.3269
1
+
74
,
425
,
077
e
-
3.55923
x
.
::方程式是y=385.32691+74,425,077e-3.55923x。 -
The logistic model is appropriate because there is a maximum for how many people can know the rumor (400 students), so the model needs to level off around 400.
::后勤模式是适当的,因为最多有多少人能知道谣言(400名学生),所以该模式需要稳定在400左右。 -
The model says 1 person will know the rumor after about 3.4 days. This doesn't fit with the actual data, which found that after 3 days, 29 people knew the rumor. After 5 days, the model tends to fit the data much better.
::模型说一个人在大约3.4天后就会知道谣言。这与实际数据不符,因为实际数据发现在3天后,29人知道谣言。在5天后,模型更适合数据。 -
Sine regression works very well. The equation is
ˆ
y
=
4.033
⋅
sin
(
0.51745
x
+
0.0307
)
+
8.94582
.
::Sine 回归效果很好。 方程式是 y = 4. 033sin (0. 51745x+0.0307+8. 94582)。 -
The predicted depth is 5.392634697 feet. The actual depth is 5.4 feet. The residual is 0.073653035.
::预计深度为5.39264697英尺,实际深度为5.4英尺,剩余为0.073653035英尺。 -
The cubic regression equation is
ˆ
y
=
0.052
x
3
−
0.92837995
x
2
+
3.737
x
+
8.6615
. This model fits the data points well, but doesn't make as much sense out of the domain of 0 to 10 hours. The cubic model shows the depth continually increasing after 10 hours, which it of course wouldn't actually do. The sine model makes more sense because it is periodic, just as the depth of the water will be.
::立方回归方程为 y= 0.052x3- 0. 92837995x2+3. 737x+8. 6615。 这个模型非常适合数据点, 但是在0到10小时的域内没有那么合理。 立方方方程显示10小时后深度持续增加, 当然它不会这样做。 正弦模型更有意义, 因为它是周期性的, 正如水的深度一样 。 -
Modeling with regression allows you to quickly make predictions and generalizations about relationships between variables. When there are a lot of data, modeling helps to summarize visually and algebraically.
::以回归模式建模可以快速预测和概括变量之间的关系。 当有大量数据时,建模有助于对视觉和代数进行总结。