比较线性线性模型和赤道模型
章节大纲
-
The Purpose of This Lesson
::本课程的目的In this lesson, you will compare linear and quadratic functions by examining their equations, tables, graphs, and .
::在此教训中,您将比较线性函数和二次函数,查看它们的方程、表格、图表和 。
Activity 1 : Compar ing Lines
::活动1:比较线Interactive
::交互式互动Use the interactive below to zoom in and out to observe the lines as approaches infinity. Next, move the blue and green points to change the parameters of the given lines. Explain how you can tell which line will exceed another in the long run . Explain the conditions under which one line always exceeds another.
::使用下面的交互来缩放, 以观察 x 接近无穷的线条。 下一步, 移动蓝色和绿色的点以改变给定线条的参数。 解释您如何从长远角度判断哪条线将超过另一条线。 解释一个线条总是超过另一条的条件 。INTERACTIVELines in the Long Run-
Use the green slider in the upper right corner to z
oom in and out to observe the lines as
approaches infinity.
::使用右上角的绿色滑动器放大和放大,以观察 x 接近无穷的线条 。 -
M
ove the red and blue sliders
to change the parameters of the lines.
::移动红色和蓝色滑块以更改线条参数。
+Do you want to reset the PLIX?Work it Out
::工作出来-
Below are two
. What is the
of each? What is the
-
intercept
of each? If these two functions are graphed in a graphing window that extends 10 units from the origin in all directions, will the
intersection
between them be visible? Why or why not? Do the lines intersect? How do you know? Find the intersection point algebraically. What would be an appropriate graphing window to visualize the intersection between these two lines? Use graphing technology to experiment with varying the window so the intersection point is clearly visible.
::下面是两个。 每个函数是什么? 每个函数的 Y 界面是什么 ? 如果这两个函数在图表窗口中绘制图解, 从源头向各个方向延伸 10 个单位, 那么它们之间的交叉点会可见吗? 为什么不? 线条交叉吗? 你如何知道? 找到交叉点代数。 哪个适当的图形窗口可以直观这两行之间的交叉点? 使用图形化技术对窗口进行不同的实验, 使交叉点明显可见 。
::y=30xy=x+3000 y=30xy=x+3000-
In the problems above, you explored the question of which sequence or
function
will eventually return greater values in the long run. "In the long run" means as the
-values progress towards positive infinity. If you compare any two lines, can you tell which will return greater values in the long run? That is to say, is there an
-value after which one function always returns values that are
greater than
the other? Compare the pairs of lines below. Determine which one will return greater values in the long run. Explain your decision. Determine the
-value after which this is the case.
::在上述问题中, 您探索了从长远看哪个序列或函数最终会返回更大的值的问题。 “ 从长远看 ” 是指 x 值向正无穷度的进展。 如果您比较任何两行, 您能否知道从长远看哪个值会返回更大的值? 也就是说, 是否有一个 X 值之后, 一个函数总是返回大于另一个的值? 比较下面的两行比较。 确定从长远看哪个值会返回更大的值。 解释您的决定。 确定在哪个 x 值之后会出现这种情况 。
::a.y=xy=2x-10,000b.y=xy=0.99x+105c.y=23x+105c.y=23x+1012y=34x-1012d.y=+1020y=1100xe.y=56x+101010y=56x-108Comparing Linear Functions
::比较线性函数Given two lines with positive slopes, the line with the greater slope will exceed the other in the long run.
Activity 2 : Comparing Quadratics
::活动2:比较四方Example 2 -1
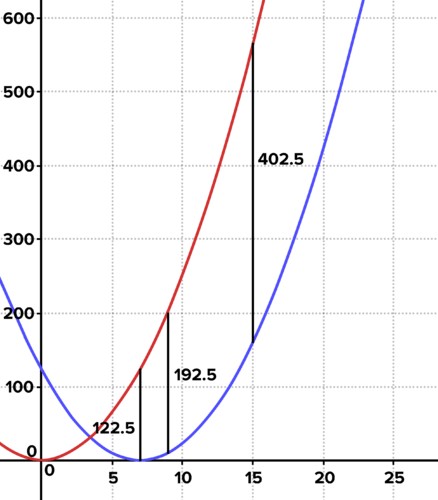
::例2-1A stopwatch is started and a rocket is launched, accelerating at 5 meters per second, per second. A second rocket is launched 7 seconds later at the same rate of acceleration. Create functions which model the height of each rocket over time, and graph. What is the domain for each? Will there ever be a single time when the second rocket has the same height as the first? Explain. Write an expression for the difference in height of the first rocket from that of the second as a function of the time on the stopwatch.
::启动一个阵列,发射一枚火箭,加速速度为每秒5米,每秒5米。第二枚火箭在7秒后以同样的加速速度发射。 创建每个火箭的高度随时间变化的模型功能, 并绘制图表。 每个区域是什么? 第二枚火箭的高度是否与第一枚相同? 解释。 写下第一个火箭与第二枚火箭的高度差异的表达方式, 以此表示在阵列上的时间函数。Solution: The equations for the heights of the rockets as a function of time are:
::解答:火箭高度的方程式按时间函数为:
:xx)=2.5x2g(x)=2.5(x-7)2
The graphs of each below show that the first rocket is always above the second. Examples of the difference between the height of the two rockets are shown in the graph. This difference increases as time passes.
::以下各图显示,第一枚火箭总是高于第二枚,两枚火箭的高度差异实例在图中显示,随着时间的流逝,这一差异会增加。The graph demonstrates that the first rocket is always above the second.
::该图显示,第一枚火箭总是高于第二枚火箭。The expression for the difference between the heights of the two rockets at time can be expressed by a new function:
::两枚火箭在时间x的高度之差的表达方式可以用一个新的函数表示:
::函数扩展 (x) =2.5x2- 2.5(x-7) 2 =2.5x2- 2.5(x-7) = 2.5x2(x-7) = 2.5x-2(x-7)(x-7-7) = 弧度(x) = 2.5x2- 2.5(x2- 14x+49) 定义 弧度(x) = 2.5x2- 2.5(x2- 14x+49) 扩大两个二氧化性(x) = 2.5x2- 2.5x2+35x - 122.5 分配(x) = 35x- 12.5. 简化Interactive
::交互式互动Use the interactive below to zoom in and out of the graph of two quadratic functions. Next, move the blue and green points sliders to change the parameters.
::使用下面的交互效果来缩放两个二次函数的图形。 下一步, 移动蓝色和绿色点滑动符以更改参数 。-
Under what conditions does one quadratic always exceed the other?
::在什么条件下一个二次曲线总是超过另一个? -
Under what conditions do the quadratics intersect in two points? In these cases, which quadratic returns greater
-values as
progresses towards
positive
or
negative infinity? Why?
::在什么条件下四方形在两个点上交叉?在这种情况下,哪种四方形返回了更大的Y值,因为x向正或负无穷进进进?为什么? -
Under what conditions do the quadratics intersect at one point?
In these cases, which quadratic returns greater
-values as
progresses towards positive
or
negative infinity?
::在什么条件下四方形在一个点上交错?在这些情况下,哪种四方形返回了更大的y值,因为 x 向正或负无限度进进? -
Under what conditions do the quadratics intersect in no points?
In these cases, which quadratic returns greater
-values as
progresses towards positive or negative infinity?
::在什么条件下四方形无点相交?在这些情况下,哪种四方形返回了更大的 Y 值,因为 x 向正或负无限度进进?
INTERACTIVETwo Quadratics-
Use the green slider in the top right corner to zoom in and out of the graphs of the two quadratic functions.
::使用右上角的绿色滑动器放大两个二次函数的图形。 -
Move the red and blue sliders to change the parameters.
::移动红色和蓝色滑块以更改参数。
+Do you want to reset the PLIX?Comparing Quadratic Functions
::比较二次函数Two quadratics with the same leading coefficient (and thus the same acceleration) can intersect in at most one point.
::具有相同主要系数(因而也是相同的加速度)的两种二次方位体,最多可以相互交错一个点。If two quadratics have positive leading coefficients, the one with the greater leading coefficient (and thus the greater acceleration) will return greater -values as progresses towards positive or negative infinity.
::如果两个象形系数为正正正正正正正正正正正正正正正正正正负负负的系数,则具有较大正正正正正正系数(从而加速度更高)的系数将随着正向正负无穷度的x的进展而产生更大的y值。Example 2 -2
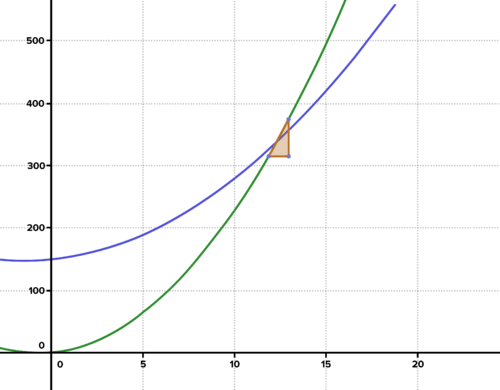
::例2-2Fred's boat in a river is accelerating at 4 meters per second, per second. The river is flowing at 3 meters per second. Gillian's boat is accelerating at 2 meters per second, per second, in the same river, and gets a head start of 150 meters on Fred's boat (meaning at the start of the race, Gillian's boat is already 150 meters ahead).
::弗雷德的船在河中加速,每秒4米,每秒3米。河水在每秒3米。吉莉安的船在同一条河中加速,每秒2米,每秒2米,在弗雷德的船上领先150米(这意味着在比赛开始时,吉莉安的船已经领先150米)。-
Create functions which model the
distance
each has traveled as a function of time. Graph.
::创建函数, 以模型模式显示每个人作为时间函数所穿行的距离。 图表 。 -
Find the slopes over equal intervals to compare the speeds of each boat over time. Compare their speeds over time.
::以等距间隔查找斜坡以比较每艘船在时间上的速度。 比较它们在时间上的速度 。 -
Approximately how fast is each boat traveling when the second passes the first? Explain how you arrived at these values.
::解释你是如何到达这些值的。 -
Write and solve an
equation
to determine when the first boat passes the second. How far has each boat gone at this time?
::写一个方程,确定第一艘船何时通过第二艘船。 -
In the long run, which boat will always be further ahead? Explain.
::从长远看,哪条船总是更远?解释一下。
Solution: This is a scenario explored in previous lessons. Given constant acceleration, an initial velocity, and an initial position, the distance an object has traveled after units of time is given by the equation
::解答 : 这是在以往课程中探索的情景 。 根据恒定加速度、 初始速度和初始位置, 公式 y= 12ax2+v0x+y0 给出了一个对象在x 单位时间后所穿行的距离 。
::f(x)=2x2+3xg(x)=x2+3x+150The graph shows that the boat starting further back passes the boat starting 150 meters ahead after around 12 seconds. It is evident from the graph that Fred's boat is going faster than Gillian's when he passes her, because his graph is steeper.
::图表显示,从后退更远的船在大约12秒后从前150米处经过该船。 从图中可以明显看出,弗雷德的船在经过吉利安时速度比吉利安快,因为他的图表更陡峭。The second boat passes the first at about 12 seconds. The differences between consecutive -values in the tables below give us approximations that show the increasing speed of the boat. From time 0 on, the first boat appears to be traveling faster than the second. For example, in the first second, the first boat is traveling at an average speed of 5 meters per second, while the second boat is traveling at an average speed of 4 meters per second. The rate of acceleration for each boat is visible as the second differences.
::下面表格中的连续 y 值差异向我们提供了近似值,显示船只速度的加快。 从0到0,第一艘船的航行速度似乎比第二艘船快。例如,在第二艘船的航行速度平均为每秒5米,第二艘船的航行速度平均为每秒4米。每艘船的加速率作为第二个差异可见。
::x(x) 差异的第二不同点005155449214413327444421565The average rate of change between 12 and 13 seconds for each boat is shown in the tables below. The average speed of Fred's boat over the 12 to 13-second interval is 53 meters per second. Gillian's boat is traveling at an average of 28 meters per second over the same interval.
::每艘船的平均变化速度在12至13秒之间,如下表所示:Fred的船在12至13秒间隔内的平均速度为每秒53米;Gillian的船在同一间隔内的平均行驶速度为每秒28米。To determine when Fred's boat passes Gillian's:
::确定Fred的船何时经过Gillian的船:
::2x2+3x=x2+3x+3x+150x2=150x=150x=150x=150x=56x=12.2秒To determine how far they have each traveled at this time, we substitute the above value into either function:
::为了确定他们各自在此时所走的路有多远,我们用上述数值替换为任一函数:
::表达式排除f(56)=2(566)2,562+3(56) 替代.f(56) =2(5)2(6)2+3(56) 指数规则f.f(56) = 2(25)6+3(56) 定义 定界f.f(56) = 300+156 简化.f(56) 336.7米Because Fred's boat has a greater acceleration he was always destined to pass Gillian, and his boat will be ahead of hers for as long as the race continues.
::因为佛瑞德的船加速度更高 他注定要通过吉莉安 只要比赛继续 他的船就会领先她
Activity 3 : Comparing Functions
::活动3:比较职能Interactive
::交互式互动Use the following interactive to compare the behavior of lines and quadratics in the long run, that is, as progresses towards positive infinity. Is it possible to create a linear function with a positive slope and quadratic function with positive acceleration such that the -values of the linear function exceed those of the quadratic function in the long run? Why or why not? Explain in terms of the rate of change of each function.
::使用以下交互方式来比较线条和二次曲线的长期行为, 即 x 向正无限度进进进。 是否有可能创建一条线性函数, 带有正斜度和二次函数, 并具有正加速度, 使线性函数的 Y 值长期超过二次函数的 Y 值? 为什么或为什么不? 解释每个函数的变化速度 。INTERACTIVEQuadratic vs. Linear-
Use the green top right slider to zoom in and out of the graph of two functions.
::使用绿色右上滑动器缩放两个函数的图形。 -
Move the red and blue sliders to transform the graphs.
::移动红色和蓝色幻灯片以转换图表。
+Do you want to reset the PLIX?Work it Out
::工作出来-
Determine and compare the average rate of change over the interval
for each of the following
functions
. Find the average rate of change over different intervals as desired. Determine which
function
will return greater
-values in the long run, that is, as
progresses towards positive infinity. Explain.
::确定并比较以下函数中每个函数的间隔 8 xx% 9 的平均变化速率。 查找不同间隔的平均变化速率。 确定从长远看, 即随着 x 向正无限度进进, 哪个函数将返回更大的 Y 值。 解释 。
::a.y1 =x2y2= 3x2b.y1= 3x2+2xy2= 4x2 - 6xc.y1= 5x2+4xy2= 10x55d.y1= 0. 1x2y2= 100xe.y1= 6x2y2=x2+10xf.y1x14}2= 12x2-
Greg's boat in a river is accelerating at 6 meters per second per second. The river is flowing at 4 meters per second.
Harrison's
boat is accelerating at 4 meters per second, per second, in the same river, and gets a head start of 200 meters on the first boat. Create functions which model the distance each has traveled as a function of time. Graph. Find the slopes over equal intervals to compare the speeds of each boat over time. Compare their speeds over time.
Approximately how fast is each boat traveling when the second passes the first? Explain how you arrived at these values.
Write and solve an equation to determine when the first boat passes the second. How far has each boat gone at this time? In the long run, which boat will always be further ahead? Explain.
::Greg在一条河流中的船正在加速速度,每秒每秒6米。 河流每秒4米。 Harrison的船正在加速速度, 每秒4米, 每秒每秒4米, 在同一条河中, 并在第一艘船上有一个200米的起始点。 创建每个船行驶距离因时间的函数。 图表 。 找到每条船行驶速度的间隔相等的斜坡, 以比较每艘船的速度。 比较它们的时间速度。 估计每艘船在第二艘船行驶时速度有多快? 解释你是如何到达这些值的。 写和解析一个方程式以确定第一艘船何时过第二艘船的方程的。 每艘船这次走多远? 从长远看, 哪条船总是走得更远? 解释一下 。
Summary
::摘要-
You
can compare the rates of change of different functions by examining the differences between their
-values over equal intervals.
::您可以对不同函数的变动率进行比较,为此可以检查这些函数的 Y 值之间的不同,间隔相同。 -
The rate of change of a quadratic increases according to its acceleration.
::等离子增速根据其加速度变化速度。 -
Quadratics with greater rates of acceleration (and thus larger leading coefficients) will return larger
-values as
progresses towards infinity.
::加速率较高的四方(因而是较大的主要系数)将随着x向无限度的进化而产生较大的y值。 -
All quadratics with positive leading coefficients return greater
-values than any linear function in the long run because the slope of such a quadratic increases, while the slope of any line remains constant.
::具有正正前导系数的所有二次曲线返回的y值大于长期任何线性函数的y值,因为这种二次曲线的斜度增加,而任何一条线的斜度保持不变。
-
Use the green slider in the upper right corner to z
oom in and out to observe the lines as
approaches infinity.