线性不平等
章节大纲
-
The Purpose of This Lesson
In this lesson, you will graph linear inequalities and systems of linear inequalities. You will use inequalities and to model scenarios.
::在此教训中,您将绘制线性不平等和线性不平等体系的图表,您将使用不平等和模型假想。Introduction : Solving Linear Systems
::导言:解决线性线性系统Work it Out
::工作出来Gregory and Fernando work at bagel shops -
Gregory and
Fernando
begin their work day baking at two different bagel shops before they open to the public. At Gregory's shop, there are already 54 bagels on hand when he starts the day. He makes 120 bagels an hour. At Fernando's shop, there are already 92 bagels on hand when he starts the day. He makes 70 per hour. Approximately when will each shop have the same number of bagels? Approximately how many will each shop have?
::Gregory和Fernando在向公众开放前在两个不同的百吉饼店开始工作。在Gregory的商店,当他开始上班时手头有54个百吉饼。他每小时生产120个百吉饼。在Fernando的商店,当他开始上班时手头有92个百吉饼。他每小时生产70个百吉饼。每家商店大约何时会有相同数量的百吉饼?每个商店大约有多少个? -
Rebecca and Loida play basketball for NBA teams. Rebecca starts the season with 512 points scored in her career, while Loida starts with 329. Rebecca scores 17 points per game. Loida scores 25 points per game. After how many games does one player surpass the other player's career points total? How many points does each player have at the end of that game?
::Rebecca和Loida为NBA队打篮球。Rebecca在赛季开始时有512分,而Loida则有329分。Rebecca在每场比赛中得17分。Loida在每场比赛中得25分。在玩完多少场比赛后,一个球员胜过另一个球员的职业生涯总分?在比赛结束时,每个球员得512分? -
Gretchen owns two car and truck factories. At the first factory, it takes 5 hours to produce a car and 7 hours to produce a truck, and the factory can only
run
for 100 hours per month. At the second, it takes 7 hours to produce a car and 4 hours to produce a truck, and the factory can only run for 80 hours a month. Gretchen wants each factory to produce the same amount of cars and trucks. Approximately how many cars and trucks can they each produce?
::格雷琴拥有两家汽车和卡车工厂。 在第一家工厂,生产一辆汽车需要5小时,生产一辆卡车需要7小时,工厂每月只能运行100小时。 第二,生产一辆汽车需要7小时,生产卡车需要4小时,工厂每月只能运行80小时。 格雷琴希望每个工厂都生产同样数量的汽车和卡车。他们每人可以生产多少汽车和卡车? -
Find the
and
-
intercepts
, and g
raph the set of points that represent the
solution set
for
::查找 x 和 y 界面,并绘制一组代表为 3x+4y=12 设定的解决方案的点。
Activity 1: Graphing Linear Inequalities in Slope-Intercept Form
::活动1:绘制斜坡-截取形式线性不平等的图表Example 1-1
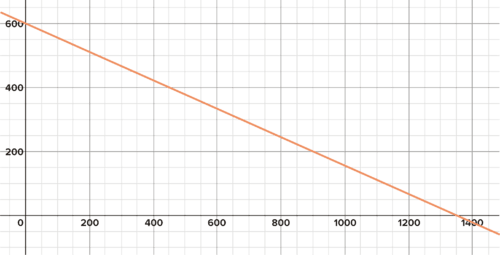
::例1-1Gladys is a wingsuit flier. She glides from a 600 meter tall cliff. She drops 4 meters for every 9 meters of horizontal movement, pulls her parachute and continues gliding along the same path until she lands in the flat valley below. Write and graph a function to model her path. A drone must be programmed to record her flight, but the drone cannot intersect her pathway--it must stay below the flight path. If the equation you graphed is what is the inequality that represents the locations that the drone can fly? Graph the inequality. Is the point on the graph of the inequality? How do you know? What are the additional constraints on the graph of the inequality so that the resulting points are consistent with the practical domain and range of the scenario?
::Gladys 是一只翅膀装的传单。 她滑翔在600米高的悬崖上。 她每9米水平运动下降4米, 拉着降落伞, 继续沿着同一条路滑行, 直到她降落在下面的平原山谷。 写一个函数 f( x) 并绘制一个函数 f( x) 来模拟她的路径。 无人机必须被编程来记录她的飞行, 但是无人机不能交叉她的路径 - 它必须停留在飞行路径下。 如果您绘制的方程式是 y=f( x), 无人机可以飞行的位置代表的不平等程度是什么? 绘制不平等的图上是点 (900 500 ) ? 你怎么知道不平等的图上还有什么额外的限制? 不平等的图上还有哪些额外的限制, 使得由此产生的点与实际领域和情景范围一致?Solution: The equation for Gladys's flight is:
::解决方案:格拉迪斯飞行的方程式是:
::f(xx) * 49x+600Here is the graph of
::这里是 y=f( x) 的图形 :Gladys is a wingsuit flyer who jumps from a 600 meter cliff
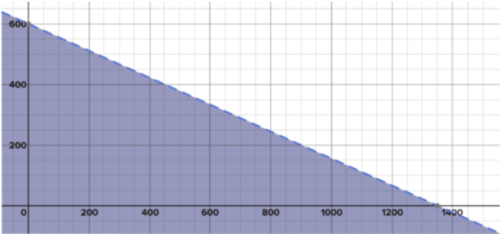
::格拉迪斯是一只从600米悬崖跳下来的 翅膀装传单The above graph is the set of all points such that:
::上图是所有点( x,y) 的集, 包括: y=f( x)The drone cannot fly along this path. The drone can only fly below this path. The locations where the drone can fly is the set of all points such that:
::无人驾驶飞机无法沿着这条路径飞行。无人驾驶飞机只能飞到这条路径下方。无人驾驶飞机能够飞行的地点是所有点(x,y)的组合(x,y),例如:
::y < f( x)That is:
::即:
::y* 49x+600The set of all points that make this inequality true consists of an infinite number of points below the line. In the table below are two examples of points that make the inequality true and one that makes the inequality false:
::使这种不平等成为事实的一组所有要点由线下无限多的点组成。 在下表中有两点例子说明不平等是真实的,一个则说明不平等是虚假的:
::以不平等 True 或 False (90,200,200,20049(90)+600200<560True. (900,100,100,10049(900)+600100<200True.(900,500)500 49(900)+600500<200False)测试。To graph all the points below the line, you shade the entire region below the line. Note that is not in the shaded region:
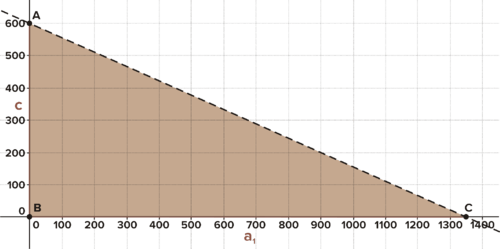
::要绘制线下所有点的图,请将线下整个区域阴影化。请注意,(900,500)不是阴影化区域:Gladys' flight path with the area under it shaded Shading below the line gives us points that have negative coordinates , which is not consistent with the scenario. The region should be constrained to and
::线下阴影显示有负坐标的点数,这与假设情况不符。 区域应限制在 x+++ 和 y+++ :Gladys' flight path from Figure 2, constrained to ensure positive values
::格拉迪斯从图2的飞行路线Note that when only graphing the inequality the line is graphed dotted, as no points on the line are part of the solution set of
::请注意,当只绘制不平等 y < f( x) 的图形时, y=f( x) 线会被用图形表示, 因为线上没有点是 y < f( x) 的解决方案集的一部分 。Graphing a Linear Inequality
::线性不平等图图The graph of an inequality is the set of all points below the line
The graph of the linear inequality is the set of all points above the line
::线性不平等的图形 y>f(x) 是行 y=f(x) 上方所有点的集 。The line is graphed dotted in these cases because points on the line are not in the solution set of the inequality.
::y=f(x) 线在这些情况下是用图形表示的虚点,因为线上的点没有处于不平等的解决方案中。Testing points in the inequality can be used to confirm you've shaded correctly.
::不平等的测试点可以用来确认你是否遮蔽了正确的阴影。Work it Out
::工作出来-
A wingsuit flier glides from an 850 meter cliff, dropping 3 meters for every 5 of horizontal movement. Write an equation to represent the function. A drone can only fly below the flight path of the flier. Write and graph an inequality to represent the set of
points
where
the drone can fly. Is the point
in the solution set? How do you know? Based on the practical domain of the scenario, what additional constraints should be placed on the drone's movements?
::从850米悬崖上飞出的翅膀飞翔的滑翔伞, 水平移动的每5米空降3米。 写一个方程式来代表此功能 。 无人驾驶飞机只能飞到飞行路径下方 。 写并绘制一个不平等图来代表无人驾驶飞机可以飞行的一组点 。 解决方案中是否设定了点( 400 400 400美元) ? 你如何知道? 根据情景的实际范围, 无人驾驶飞机的移动应该受到哪些额外的限制 ? -
Graph the inequalities below:
::将不平等情况图如下:
::y>45x- 20b.y511x+6c.y4x+10( 提示: 图形显示此时间的线条固体 。) d. y4 为什么 c 的提示在此也有用 ? e. x> 5f. y14x
Activity 2: Graphing A Linear Inequality in Standard Form
::活动2:在标准表格中绘制一线性不平等图Example 2-1
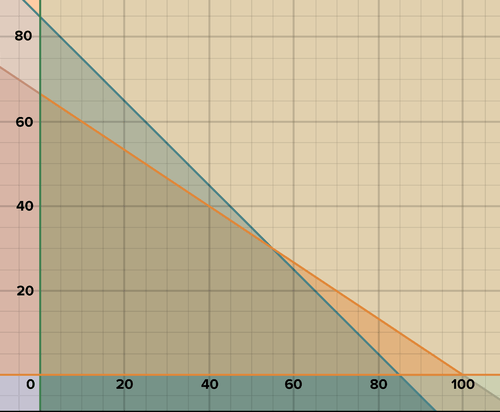
::例2-1Oscar and Valeria are planning an 850 mile road trip. Oscar drives at 60 miles per hour, and Valeria at 75 miles per hour. Write an equation which represents the various ways they can split the driving to arrive at their destination. Write the coordinates of 3 points on the line. In fact, Oscar and Valeria want to stop en route to their destination and spend the night. Write an inequality that represents all the ways they can split the driving to spend the night prior to arriving. Find one point that is in the solution set for the inequality and one which is not. Graph the solution set for the inequality. Constrain your graph so it is consistent with the practical domain and range of the scenario.
::Oscar和Valeria计划进行850英里的公路旅行。 Oscar 和 Valeria 以每小时60英里的速度驾驶, Valeria 以每小时75英里的速度驾驶。 写一个方程, 表示他们可以将驾驶车分成不同方式到达目的地的方程式。 写上线上3点的坐标。 事实上, Oscar 和 Valeria 想要在前往目的地的路上停下来, 过夜。 写上一种不平等, 代表他们可以把驾驶车分成所有方式在到达前过夜。 找到一个为不平等设定的解决方案中的点, 而不是一个。 绘制为不平等设定的解决方案。 将您的图表与实际领域和情景范围保持一致 。Solution:
::解决方案: 60x+75y<850
::xy011131416055127
::在不平等轨迹或假(2,3,60(2)+75(3)<850345<850True.(7,1060(7)+75(10)<850False)<850170<850False>中测试。The graph of the inequality, constrained to and
::受xxxx0 和 y_0限制的不平等情况图:Oscar and Valeria are planning an 850 mile road trip Graphing a Linear Inequality in Standard Form
::标准表格中线性不平等图Graph the and -intercepts of the corresponding line.Graph the line solid or dotted as appropriate.
::酌情绘制固体线或点形线图。Test points and shade either above or below the line as appropriate.
::酌情在线上或下方试验点和阴影。Work it Out
::工作出来-
Francesco and Sheldon are planning a 340 mile road trip. Francesco drives at 50 miles per hour and Sheldon at 80 miles per hour. Write the equation that represents all the possible ways they can divide the driving and arrive at their destination. Give the coordinates of 3 points on this line. Write and graph an inequality that shows all the possible combinations of driving they can do on the first day without arriving at their destination. Give the coordinates of one point in the solution set to the inequality and the coordinates of another point that is not. Add constraints to the region you graphed based on the practical restrictions on domain and range dictated by the scenario.
::Francesco和Sheldon计划进行340英里的公路旅行。Francesco每小时驾驶50英里,Sheldon每小时驾驶80英里。写一个方程,代表他们可以分割驾驶的所有可能方式,并到达目的地。给这条线上3点的坐标。写一个不平等的图表,显示他们在没有到达目的地的情况下在第一天可以驾驶的所有可能的组合。给出一个点的坐标,用于解决不平等问题,而另一个点的坐标则不是。加上一些限制,您根据情景对地域和范围的实际限制而绘制的区域。 -
Graph the solution set for the inequality:
::为不平等设定的解决方案图 : 2x+5y < 8 -
Solve the previous graph for
so that the inequality is in
slope-intercept form
. Is the graph the same as above? Why or why not?
::解决 y 的上一个图形, 以便不平等以斜坡界面的形式出现。 图表是否和上面一样? 为什么或为什么没有? -
Solve the inequality:
Explain the steps involved. Check your solution by selecting a value for
and substituting it back into the original inequality.
::解决不平等: - 4x7. 解释所涉步骤。 通过选择 x 的值来检查您的解决方案, 并将其替换为原始的不平等 。 -
Graph the solution set for the inequality:
(Hint: either solve by first adding
to both sides, or remember to switch the inequality sign when dividing by a negative!)
::为不平等设定的解决方案图 : - x - y\\\ 1. (提示: 要么先将 y 添加到两边, 要么在除以负值时记住切换不平等符号 ! ) -
Convert the above inequality to slope-intercept form. Confirm that the graph of the inequality in slope-intercept form matches your graph above.
::将上述不平等转换为斜坡界面形式。 确认斜坡界面形式的不平等图与您上面的图表相符 。
Activity 3: Graphing A System of Linear Inequalities
::活动3:绘制线性不平等体系图W hen you graphed inequalities above and constrained them by stating and you were graphing a system of 3 inequalities. The graph in Example 2 was the graph of the system below. The shaded points make all three inequalities true. Take care that each line is solid or dotted as appropriate.
::当您用图表显示上面的不平等,并通过说明 x0 和 y0 来限制它们时, 您正在绘制3种不平等的系统图。 例2中的图表是下面的系统图。 阴影点将所有三种不平等都变为真实的。 注意每条线是坚固的, 或酌情点头 。
::60x+75y < 850x=0y_0Three inequalities, solved simultaneously Example 3-1
::例3-1Hermione runs a factory which produces cars and trucks. It takes 2 hours to produce a car, and 3 to produce a truck. Due to labor constraints, the factory can only stay open 200 hours per month. Due to raw material constraints, the factory can only produce 85 vehicles total. Create and graph inequalities which represent the possible number of cars and trucks that can be produced. Find the intersection point of the two lines that are not vertical or horizontal. Is this point part of the solution to the system? How do you know? Find one other point that is part of the solution to the system.
::Hermione经营一个生产汽车和卡车的工厂,生产汽车和卡车需要2小时,生产卡车需要3小时。由于劳动限制,工厂只能每月开放200小时。由于原材料限制,工厂只能生产总共85辆汽车。制造和图示不平等,代表了可以生产的汽车和卡车的可能数量。找到两条线的交叉点,不是垂直的或横向的。找到两条线的交叉点,这是系统解决方案的一部分吗?你怎么知道?找到另一个点,这是系统解决方案的一部分。Solution: Let represent the number of cars and the number of trucks:
::解决方案: 让 x 代表汽车数量和卡车数量 :
::2x+3y=200x+y=85x=0y=0To find the intersection point of the two lines:
::要找到两条线的交叉点:
::公式Explantation2x+3y=200x+y=852x+3y=2002x+2y=170 将第二个方程式以 2.y=30 表示清除方法解析 。 (减号.) x+30=85 = y 转换值以查找相应的 x- value.x=55(55,30)The above point is in the solution set for the system of inequalities. The graph of the solution set for the system of inequalities. Any point that is within all the shaded regions makes every inequality true. Be careful to ensure that lines are dotted or solid as appropriate for the given inequality.
::以上就是为不平等制度制定的解决办法,为不平等制度制定的解决办法图,在所有阴影区域内的任何点都使不平等成为事实,要谨慎,确保线条是圆点的或坚固的,适合特定的不平等情况。Hermione runs a factory that produces cars and trucks Graphing a System of Linear Inequalities
::线性不平等体系图图Graph each linear inequality individually.Points that are in every shaded region represent the solution to the system.
::每个阴影区域的点代表着这个系统的解决办法。Work it Out
::工作出来-
Victor is a potter. It takes him 2 hours to make a bowl and 7 to make a vase, and he dedicates 200 hours a month to the craft. Due to material constraints he can only make
50
pieces per month. Create and graph a system of inequalities to represent the scenario. Find the intersection point between the two lines that aren't vertical or horizontal. Find one other point that is in the solution set for the system.
::Victor是一个陶匠。他需要2小时才能做碗,7小时才能做花瓶,他每月要花200小时才能做手工艺品。由于物质限制,他只能每月做50件。创建和绘制一个不平等体系来代表情景。找到两条不是垂直或水平的线之间的交叉点。在为系统设定的解决方案中找到另一个点。 -
Harold is a tailor who owns his own clothing boutique. He takes 3 hours to make a blouse and 5 to make a dress, and he dedicates 75 hours per month to the task. Each month, he works to ensure that he has made at most 8 more blouses than dresses. Create and graph a system of inequalities to represent the scenario. Find the intersection point between the two lines that aren't vertical or horizontal. Find one other point that is in the solution set for the system.
::哈罗德是一位裁缝,拥有自己的服装。他需要3小时制衣,5小时制衣,每月75小时制衣。每个月,他都努力确保自己最多比裙子多做8件。创建和绘制一个不平等体系来代表情景。找到两条线之间的交叉点,而两条线不是垂直的,也不是横向的。在为系统设定的解决方案中找到另一个点。
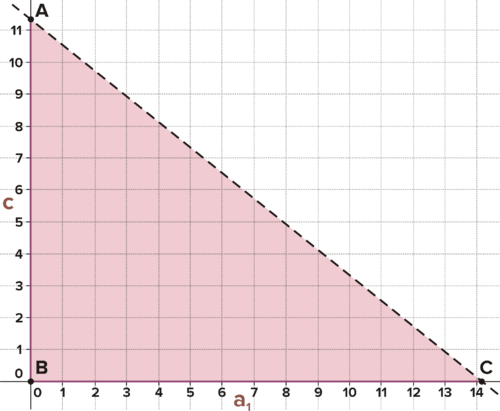
Interactive
::交互式互动Use the interactive below to experiment with changing the parameters for a linear inequality in slope- intercept form. Try to find patterns that relate the values of each term to the resulting shading. Explain these results.
::使用下面的交互作用来实验如何改变斜坡界面线性不平等的参数。 试着找到将每个词的值与由此产生的阴影联系起来的模式。 请解释这些结果 。INTERACTIVELinear InequalitiesMove the red point to change the and values.
::移动红点以更改 x 和 y 值。+Do you want to reset the PLIX?Summary
::摘要-
The graph of an inequality is the set of all points that make the inequality true.
::不平等的图示是使不平等成为事实的所有各点的组合。 -
Given the inequality in slope-intercept form, graph the corresponding line and shade above or below as appropriate.
::鉴于斜坡间隔形式的不平等,请酌情绘制上下相应的线和阴影。 -
> or < means graph the line dotted, otherwise solid.
::> 或 < 表示虚线图,否则为固线。 -
Given the inequality in standard form, graph the line, then test points to determine where to shade.
::鉴于标准形式的不平等,用图表绘制线条,然后用测试点来确定阴影的位置。 -
You can also convert from standard form to slope-intercept form.
::您也可以将标准格式转换为斜坡界面。 -
The graph of a basic inequality in two variables looks like
::两个变量中的基本不平等情况图表看起来类似 < f(x) 。 -
Testing points in the inequality can be used to confirm you've shaded correctly.
::不平等的测试点可以用来确认你是否遮蔽了正确的阴影。
-
Gregory and
Fernando
begin their work day baking at two different bagel shops before they open to the public. At Gregory's shop, there are already 54 bagels on hand when he starts the day. He makes 120 bagels an hour. At Fernando's shop, there are already 92 bagels on hand when he starts the day. He makes 70 per hour. Approximately when will each shop have the same number of bagels? Approximately how many will each shop have?