从视觉和数字角度分析数据集:审查
章节大纲
-
Analyzing Data
::分析数据As computer capabilities have increased, so has the prevalence of data analysis. Data science and analysis is a growing field. Data scientists and analysts work for businesses, sports teams, the government, and in many more fields. A set of data is a collection of related information. Examples of data sets include the temperatures in a certain area throughout a year and the salaries of computer programmers from a chosen group. A characteristic of a data set is known as a statistic . The characteristics that you will focus on are measures of variability and measures of center.
::随着计算机能力的提高,数据分析的普及程度也随之提高。数据科学与分析是一个日益增长的领域。数据科学家和分析师为企业、体育队、政府和其他许多领域工作。一组数据是相关信息的收集。数据集的例子包括某一地区一年中的温度和选定群体的计算机程序员的工资。数据集的一个特征被称为统计。你将关注的特征是可变性的计量和中心计量。
Measures of Center vs. Measures of Variability
::" 中心措施 " 与 " 差异性措施 " 的比较Two ways to describe a data set are by using a measure of center and using a measure of variability. A measure of center is a single number used to describe a typical value from a set of numeric data. Measures of center include the mean and the . A measure of variability is a single number used to describe the spread of a data set. It can also be called a measure of spread. A measure of variability tells us how close together the numbers in the data set are. The variability of a data set can tell you how reliable the mean is as a measure of center and how likely it will be to obtain a specific result. A data set with a low variability means that the numbers in the data set are relatively close together. A data set with a high variability means that the numbers in the data set are relatively far apart.
::描述数据集的两种方式是使用中枢测量和变量测量。 中枢测量是用来描述一组数字数据的典型值的单一数字。 中心测量包括平均值和 。 中心测量包括平均值和 。 变量测量是用来描述数据集分布的单一数字。 也可以称为扩展度。 变量测量可以告诉我们数据集中数字的相近程度。 数据集的可变性可以告诉您该平均值作为中心测量的可靠性, 以及获得具体结果的可能性。 数据组的低变量组意味着数据集中的数字相对接近。 数据组中数字的可变性组意味着数据集中的数字相对相距很远。
Mean and MAD
::平均和MAADThe most commonly used measure of center is the mean. The mean , more commonly thought of as the average of a data set, is the sum of the data values divided by the number of data values in the set. The mean can be thought of as the weighted center of the data set.
::最常用的中心量度是平均值。 平均值, 更常见地称为数据集的平均值, 是数据集中数据值除以数据值数的总和。 平均值可以被视为数据集的加权中心 。Cell phones Example
::示例示例示例示例Find the mean of the following prices of smartphones: $550, $320, $750, $500, $480.
::寻找以下智能手机价格的平均值:550美元、320美元、750美元、500美元、480美元。Step 1: Add the values.
::第1步:加上数值。550 + 320 + 750 + 500 + 480 = 2600
Step 2: Divide the sum by the number of values in the data set.
::第2步:将总和除以数据集中的数值数。2600 ÷ 5 = 520
Answer: $520
::答复:520美元The mean absolute deviation (MAD) is a measure of variability used to measure how spread out the values in a data set are. It is the mean (average) the distance between the data values and the mean of the data set.
::平均绝对偏差(MAD)是用来衡量数据集中数值分布方式的可变度尺度,是数据值与数据集平均值之间的平均距离(平均)。Example
::示例示例示例示例Find the mean absolute deviation of the smartphone prices from the previous example: $550, $320, $750, $500, $480.
::找出智能手机价格与前一个例子的绝对偏差:550美元、320美元、750美元、500美元、480美元。Step 1: Find the mean.
::第一步 找出暗点The mean was found in the previous example to be 520.
::在上一个例子中,平均值为520。Step 2: Subtract each data value from the mean.
::第2步:从平均值中减去每个数据值。- 520 - 550 = -30
- 520 - 320 = 200
- 520 - 750 = -230
- 520 - 500 = 20
- 520 - 480 = 40
Step 3: Find the absolute value of each difference.
::第3步:确定每项差异的绝对值。- |-30| = 30
- |200| = 200
- |-230| = 230
- |20| = 20
- |40| = 40
Step 4: Find the mean of the absolute value of the differences.
::第4步:找出差异绝对值的平均值。30 + 200 + 230 + 20 + 40 = 520
520 ÷ 5 = 104
Answer: $104
::答复:104美元This means that on average, the values in the data set are either 104 greater than or 104 less than the mean.
::这意味着,平均而言,数据集中的数值比平均值高104倍或小104倍。Discussion Questions
::讨论问题 讨论问题-
Would a mean absolute deviation of 104 mean the same thing if we were comparing house prices?
::如果我们比较房价的话,104的绝对偏差是否意味着同样的事情? -
What could we say about the data if the mean average
deviation
of the cell phone prices was 10?
::如果移动电话价格的平均平均偏差为10,我们又能对数据说什么呢?
Use the interactive below to explore how the values in the data set affect the mean and MAD.
::使用下面的交互数据来探讨数据集中的数值如何影响平均值和元数据。INTERACTIVEData Effects on Mean and MAD-
Drag the red sliders and observe the changes to mean and MAD.
::拖曳红色滑块并观察中值和 MAD 的更改 。
+Do you want to reset the PLIX?Discussion Questions
::讨论问题 讨论问题-
What values would produce a mean of 4?
::什么值会产生4的平均值? -
What values would produce the
minimum
possible MAD?
::哪些值能产生尽可能最低的MAD? -
What values would produce the
maximum
possible MAD?
::哪些值能产生最大可能的MAD? -
What values would produce the maximum possible mean?
::什么样的数值能产生最大可能平均值? -
What values would produce the minimum possible mean?
::何种价值能产生尽可能最低的平均值?
Use the interactive below to test your reaction speed. You will run the test multiple times to make your own data set and then find the mean and mean average deviation.
::使用下面的交互效果来测试您的反应速度。 您将多次运行测试, 制作您自己的数据集, 然后找到平均值和平均偏差 。INTERACTIVEMean and MAD of Reaction Times-
Press the white button to start the reaction test.
::按白按钮启动反应测试 。 -
When the red square on the screen turns green, click the square to record your reaction time.
::当屏幕上的红色方块变绿时,请单击方块记录您的反应时间。 -
After running 5 trials, enter the mean and MAD of your reaction times into the boxes rounded to the nearest hundredth.
::运行 5 个测试后, 请输入您反应时间的平均值和 MAD 值, 输入到四舍五入到最接近一百的盒子中 。
+Do you want to reset the PLIX?
Median and Interquartile Ranges
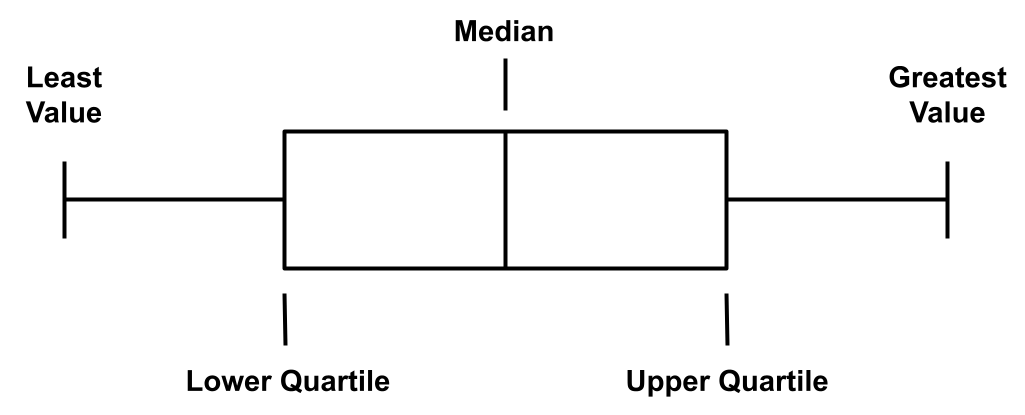
::中位和孔径范围Another commonly used measure of center is the median. The median represents the middle value of an ordered data set. The median is often displayed in a box plot. This type of visual display shows how values in a data set are distributed or spread out in addition to showing the median. To make a box plot, first find the five critical values for the data set:
::另一个常用的中心尺度是中位值。中位值代表定购数据集的中值。中位值通常显示在框图中。这种视觉显示显示显示数据集中的数值如何分布或除显示中位数外再分散。要绘制框图,首先要找到数据集的五个关键值:-
T
he lowest value
::最低价值 -
T
he
lower quartile
- the median of the lower half of the data.
::下四分位数 - 数据下半部分的中位数。 -
T
he median
::中位数 -
T
he
upper quartile
- the median of the upper half of the data.
::上四分位数 -- -- 数据上半部的中位数。 -
T
he greatest value
::最大值
Interquartile range The accompanying measure of variability for the median is the interquartile range . The interquartile range (IQR) is the difference between the upper and lower quartiles. The interquartile range can be found by subtracting the lower quartile from the upper quartile. Since every quartile represents 25% of the data, the interquartile range represents 50% of the data. A randomly chosen data value will have approximately a 50% chance of falling in the interquartile range.
::中位值的可变性的附带度量是内分量范围。 内分量范围( IQR) 是上角和下角的差。 内分量范围可以通过从上角中减去下角四分点来找到。 由于每个四分点代表了数据的25%, 内分量范围代表了数据的50%。 随机选择的数据值在内角范围内的下降概率约为50% 。Snowfall on a House Example
::示例示例示例示例Find the median amount of snowfall in Vermont from October through April: 2 inches, 8 inches, 12 inches, 23 inches, 17 inches, 25 inches, 7 inches.
::从10月到4月,在佛蒙特州发现下雪的中位数:2英寸,8英寸,12英寸,23英寸,17英寸,25英寸,7英寸。Step 1: Line up the numbers from least to greatest.
::第1步:将数字从最小排到最大。2, 7, 8, 12, 17, 23, 25
Step 2: Choose the middle number. If there are two middle numbers, add them and divide by two to find the center.
::步骤 2: 选择中间数字。 如果有两个中间数字, 添加它们, 并除以 2 以找到中心 。The median is 12.
::中位数是12。Answer: 12 inches
::答复:12英寸Example
::示例示例示例示例Find the interquartile range of the values from the previous example: 2 inches, 8 inches, 12 inches, 23 inches, 17 inches, 25 inches, 7 inches.
::从上一个示例中找到数值的内径范围: 2 英寸, 8 英寸, 12 英寸, 23 英寸, 17 英寸, 25 英寸, 7 英寸。Step 1: Find the median.
::第一步 找到中位数We found the median in the previous example to be 12.
::我们发现上一个例子的中位数是12。Step 2: Find upper quartile by finding the median of the upper half of the data.
::第2步:通过找到数据上半部分的中位值来发现上四分位数。Remove the number(s) used to find the median and find the median of the numbers greater than the median. The median of 17, 23, and 25 is 23.
::删除用于查找中位数的数字,发现中位数的中位数大于中位数。中位数17、23和25是23。Step 3: Find lower quartile by finding the median of the lower half of the data.
::第3步:通过找到数据下半部分的中位值来查找下四分位数。Remove the number(s) used to find the median and find the median of the numbers less than the median. The median of 2, 7, and 8 is 7
::删除用于查找中位数和找到中位数中位数中位数的中位数,发现中位数中位数中位数低于中位数的中位数。中位数为 2、7和8,中位数为 7Step 4: Subtract the lower quartile from the upper quartile to find the interquartile range.
::第4步:从上四分位中减去下四分位数,以找到孔径范围。23 - 7 = 16.
Answer: The interquartile range is 16.
::答复:孔径范围为16。Discussion Questions
::讨论问题 讨论问题-
Between which 2 numbers will approximately 50% of the data fall?
::大约50%的数据会下降2个数字? -
The MAD of the data is approximately 7. How does this compare to the IQR of 16?
::数据MAD大约为7,这与16的IQR相比如何? -
When do you feel that mean would be a better measure of center and when do you feel that median would be a better measure of center?
::你何时会觉得这个意思 是一个更好的中枢度量? 什么时候你觉得中位度是中位度度度量?
Use the interactive below to explore how the values in the data set affect the median and interquartile range.
::使用下面的交互数据来探讨数据集中的数值如何影响中位数和内位数范围。INTERACTIVEData Effects on Median and IQR-
Drag the red sliders and observe the changes to median and IQR.
::拖曳红色滑块并观察中位数和 IQR 的变化。
+Do you want to reset the PLIX?Discussion Questions
::讨论问题 讨论问题-
What values would produce a median of 4?
::得出中位数为4的值是多少? -
How would the strategies needed to find the maximum and minimum median and IQR compare those that you used in the mean/MAD interactive?
::要找到最大和最低中位数和智商报告的战略如何与中位数/元数据互动中使用的战略进行比较?
Let's revisit the reaction time interactive from above only this time we will find the median and interquartile range. Compare your answers with those from the previous reaction time interactive.
::让我们从上方重新审视反应时间互动, 只有这一次我们才能找到中位数和内位数范围。 比较您的答复和上一个反应时间互动的答案 。INTERACTIVEMedian and IQR for Reaction Times-
Press the white button to start the reaction test.
::按白按钮启动反应测试 。 -
When the red square on the screen turns green, click the square to record your reaction time.
::当屏幕上的红色方块变绿时,请单击方块记录您的反应时间。 -
After running 5 trials, enter the median and IQR of your reaction times into the boxes.
::运行 5 个测试后, 请将您反应时间的中位数和 IQR 输入框中 。
+Do you want to reset the PLIX?
Finding Median and Interquartile Range
::查找中位和孔径范围Use the interactive below to practice finding the median and interquartile range of a data set.
::使用下面的交互数据来实际查找一组数据集的中位数和孔径范围。INTERACTIVEMedian Home Prices-
Click on 6 of the houses on the block.
::点击6个街区上的房子。 -
Enter the median and interquartile range of the set of prices of houses you selected.
::输入您选择的一套房屋价格的中位数和内分数范围。 -
Press the button when finished to try a different set of houses.
::完成后按此按钮尝试不同的房子 。
+Do you want to reset the PLIX?Discussion Question
::讨论问题In the above interactive, did you come across any challenges when finding the IQR for six values? How is it different than if you had five values instead?
::在上述互动中,在找到六种值的IQR时,你是否遇到过任何挑战? 与拥有五种值相比,它有什么不同呢?Summary -
A
statistic
is a characteristic of a data set.
::统计数据是数据集的一个特征。 -
A
measure of center
is a “typical” value that describes a data set.
::中心度量是一个描述数据集的“典型”值。 -
A
measure of variability
is a number that is used to describe the spread of a data set.
::衡量可变性的尺度是用来描述数据集分布的数字。 -
The
mean
of a data set (also known as the average) is the sum of the data values divided by the number of data values in the set.
::数据集的平均值(也称为平均值)是数据值除以数据集中数据值数的总和。 -
The
mean absolute deviation (MAD)
is the measure of variability that is used to measure how spread out the values in the data set are.
::平均绝对偏差(MAD)是用于衡量数据集中数值分布方式的可变性度。 -
The
median
of a data set is the middle value of an ordered data set.
::数据集的中值是订购数据集的中值。 -
When making a box plot include:
-
The lowest value
::最低价值 -
The lower quartile (the median of the lower half of the data)
::下四分位数(数据下半部的中位数) -
The median
::中位数 -
The upper quartile (the median of the upper half of the data)
::上四分位(数据上半部的中位数) -
The highest value
::最高值
::当绘制一个框绘图时, 包括: 最小值 下四分位( 数据下半的中位数) 中位值 上四分位( 数据上半的中位数) 最高值 -
The lowest value
-
The
interquartile range (IQR)
is the difference between the upper and lower quartiles.
::孔径范围(IQR)是上角和下角四分位之间的差。