数字比较两种数据分布
章节大纲
-
Clean Water
::清洁清洁饮水Clean Water Water purity is important to the survival of people, animals, and plants in an ecosystem. Scientists routinely test the water we drink to ensure that it is safe. Ammonia, Nitrate, and many more contaminants can pollute water, rendering it unsafe to drink. There are a number of tests scientists use to determine whether water is safe. One such test is to measure the pH level in the water. The term pH stands for potential Hydrogen and measures the relative amount of hydrogen ions present in a sample . This number can tell you a lot about the properties of the sample.
::水纯度对于人类、动物和植物在生态系统中的生存非常重要。 科学家们定期测试我们所饮水以确保它的安全。 氨、硝酸盐和更多的污染物可以污染水,使其不安全地饮用。 科学家们用许多测试来确定水是否安全。 其中一个测试是测量水中的pH水平。 pH 表示潜在的氢,测量样本中存在的氢离子的相对数量。 这个数字可以告诉大家样本的特性。For example, surface water is considered safe if it has a pH between 6.5 and 8.5. A pH below this range is called acidic and is also known as soft water. Acidic water can contain dangerous metal ions like lead and can also cause damage to metal piping. A pH above this range is called basic or alkaline and is also known as hard water. While there are no known health risks from drinking hard water by itself, an abnormally high pH can signal that the water may be contaminated.
::例如,如果地表水的pH值在6.5至8.5之间,则被视为安全。低于该范围以下的pH值被称为酸性,也称为软水。酸性水可能含有危险的金属离子,如铅,也可能对金属管道造成损害。高于这一范围的pH值被称为基本或碱性,也称为硬水。虽然已知饮用硬水本身不会对健康造成危害,但异常高的pH值可以表明水可能受到污染。In this lesson , you will use what you know about measures of center and measures of variability to play the role of scientist and determine the safety of different water samples.
::在这一教训中,你将利用你所了解的关于中心测量和可变度测量的知识,发挥科学家的作用,确定不同水样的安全性。
Screen Time
::屏幕时间In the previous section, we compared two datasets using a double dot plot . In this section, we will calculate measures of center and measures of variability to compare datasets.
::在上一节中,我们用双点图谱比较了两个数据集。在本节中,我们将计算中心量和可变度量,以比较数据集。Mila and Xavier want to determine who uses their cell phone more. They agree to keep track of the amount of time they spend on their phones each week. The number of minutes Mila and Xavier spent on their phone is listed below:
::Mila 和 Xavier想确定谁使用手机更多。 他们同意记录他们每周花在手机上的时间。 Mila 和 Xavier花在手机上的时间如下:-
Mila - 27, 35, 51, 49, 37, 45, 50
::米拉 - 27、35、51、49、37、45、50 -
Xavier - 42, 75, 94, 21, 106, 44, 38
::Xavier - 42, 75, 94, 21, 106, 44, 38
Let's begin by finding the mean and of each dataset. The mean and median of Mila's data is below:
::让我们首先找出每个数据集的平均值和中位数。Mila数据的平均值和中位数如下:Next, we will find the mean and median of Xavier's data.
::接下来,我们将找到Xavier数据的中值和中位数。When we compare the means, we can see that Xavier had a mean usage time almost 20 minutes greater than Mila's. However, Mila has a median usage time of 1 more than Xavier. Let's look to the mean average deviation and interquartile range to help make sense of the measures of center.
::当我们比较手段时, 我们可以看到 Xavier 的平均使用时间比 Mila 的使用时间高出近20分钟。 然而, Mila 的中位使用时间比 Xavier 高出1 。 让我们看看平均偏差和间距范围, 以帮助理解中心测量值 。Mila Xavier MAD 7.71 27.14 IQR 15 56 Both the mean average deviation and the interquartile range support Xavier's usage times being more variable than Mila's. These statistics explain why Xavier's median usage time was less than Mila's despite having a much greater mean usage time. On three days out of the week, Xavier spent a lot of time on his phone. In this case, the mean is a more accurate statistic to compare the datasets. Additionally, since we are comparing cell phone usage over the same period of time, the mean is more appropriate because it is determined by the total usage time for Mila and Xavier.
::平均平均偏差和间距范围都支持 Xavier 的使用时间比 Mila 的多变。 这些统计数据解释了为什么 Xavier 的中位使用时间比 Mila 的平均使用时间要小得多。 在每周的三天里, Xavier 在手机上花费了大量时间。 在此情况下, 平均值是比较数据集的更准确的统计。 此外, 由于我们比较了同一期间的手机使用时间, 这个平均值更合适, 因为它取决于 Mila 和 Xavier 的总使用时间 。
Think Fast
::快速思考In a previous lesson, you tested reaction speeds. Selena and Chloe decided to test their reaction speeds. The data from their tests is in the table below.
::在上一堂课中,你测试了反应速度。Selena和Chloe决定测试他们的反应速度。他们测试的数据见下表。Selena Chloe Test 1 0.6 sec 1.2 sec Test 2 0.5 sec 0.4 sec Test 3 0.5 sec 0.3 sec Test 4 0.5 sec 0.3 sec Test 5 0.4 sec 0.3 sec Discussion Questions
::讨论问题 讨论问题-
How can the mean help us determine who has a faster reaction time? In this case, what does it tell us?
::如何帮助我们确定谁有更快的反应时间? 在这种情况下,它告诉我们什么? -
How can the median help us determine who has a faster reaction time? In this case, what does it tell us?
::中位数如何帮助我们确定谁有更快的反应时间? 在这种情况下,它告诉我们什么? -
Since one measure of center stated that the reaction times were the same and another stated that Chloe’s reaction times were lower than Selena’s, which one should we trust? Should we trust either?
::因为一个中枢表示反应时间相同,另一个中枢则表示克洛伊的反应时间低于塞莱娜,我们应该相信谁? 我们是否应该信任呢? -
How could the MAD and interquartile range help us in coming to this conclusion?
::MAD和跨种族范围如何帮助我们得出这一结论? -
How can comparing reaction speeds be useful to a scientist?
::如何比较反应速度对科学家有用?
More Clean Water
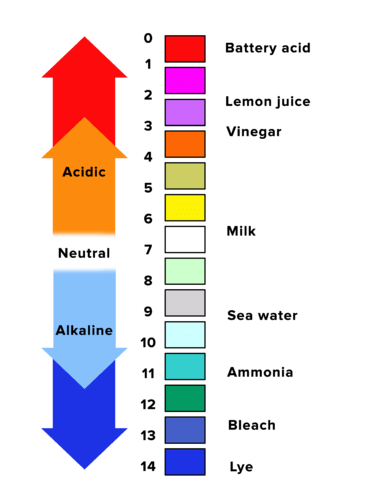
::更清洁的水Scientists will often record the pH levels of pond water to check for contamination to prevent local wildlife and plant life from being harmed by the water. To record the pH levels of water, a scientist takes a sample put in a pH strip and compares the color it turns to a chart.
::科学家通常会记录池塘水的pH水平,以便检查污染情况,防止当地野生生物和植物生命受到水的伤害。 为了记录pH水平的水,科学家将样本放在pH值条上,并将它与图表的颜色进行比较。PH Chart In the interactive below you are going to take the pH reading of several different ponds in a forest and use their pH readings to determine if the water is safe to drink.
::在下文互动部分,你们将读取森林中几个不同池塘的pH值读数,并使用其pH值读数来确定水是否安全饮用。Discussion Question
::讨论问题Based on the data taken, which ponds, if any, contain safe drinking water?
::根据所收集的数据,哪些池塘(如果有的话)含有安全饮用水?Summary -
Use the mean, median, and MAD to numerically compare two data sets.
::使用平均值、中位数和MAD来对两个数据集进行数字比较。 -
The
mean
of a data set (also known as the average) is the sum of the data values divided by the number of data values in the set.
::数据集的平均值(也称为平均值)是数据值除以数据集中数据值数的总和。 -
The
median
of a data set is the middle value of an ordered data set.
::数据集的中值是订购数据集的中值。 -
The
mean absolute deviation (MAD)
is the measure of variability that is used to measure how spread out the values in the data set are.
::平均绝对偏差(MAD)是用于衡量数据集中数值分布方式的可变性度。
-
Mila - 27, 35, 51, 49, 37, 45, 50