茎叶图,数据集的范围
章节大纲
-

Aneesa is trying to raise money for a local charity. She has 7 people in her family and she assigns each one an area to raise money. After 8 days of raising money, Aneesa counts the money that each person has raised. She calculates the following amounts: 78, 75, 52, 67, 78, 70, 86. She organizes the data on a stem-and-leaf plot .
::Aneesa试图为当地的一个慈善机构筹集资金。她家里有7人,她给每个家庭分配了一个地区来筹集资金。在8天的募款后,Aneesa计算了每个人筹集的钱。她计算了以下数额:78、75、52、67、78、70、86。她整理了干叶图的数据。Using the stem-and-leaf plot, what is the range of money that was raised by her family members?
::她的家人筹得的钱有多少?In this concept, you will learn how to use a stem-and-leaf plot to determine the range of a set of data.
::在这个概念中,你将学会如何使用干叶图来确定一组数据的范围。Using Stem-and-Leaf Plots to Find the Range of a Set of Data
::使用 Stem-and- Leaf 绘图来查找一组数据的范围You can use a stem-and-leaf plot to figure out the range of a set of data. The range is the difference between the maximum score and the minimum score.
::您可以使用干叶图来解析一组数据的范围。范围是最大分数和最低分数之间的差额。Let's look at an example.
::让我们举个例子。The smallest number in the stem-and-leaf plot is 22. You can see that by looking at the first stem and the first leaf. The greatest number is the last stem and the last leaf on the chart. In this case, the largest number is 55.
::干叶草块中最小的数量是22个,通过观察第一个干叶和第一个叶子可以看到这一点。最大的数字是图表上最后一个干叶和最后一个叶子。在这个例子中,最大的数字是55个。To find the range, subtract the smallest number from the largest number. This difference will give you the range.
::要找到范围, 请从最大数量中减去最小数量。 此差异将为您提供范围 。55 - 22 = 33
The range is 33 for this set of data.
::这组数据的范围是33。Examples
::实例Example 1
::例1Earlier, you were given a problem about Aneesa and her family.
::早些时候,你被问及阿妮莎和她的家人7 people in her family raised money for a charity organization. She made a stem-and-leaf plot to organize the data and she wants to calculate the range of money that was raised by her family members. Can you use the plot to find the range of money that Aneesa and her family raised?
::她家有7个人为慈善组织筹款。 她做了一个干叶图来组织数据,她想计算其家庭成员筹得的钱的范围。 你能利用这个图来找到Anesa和她的家人筹得的钱的范围吗?First, locate the smallest value.
::首先,找到最小值。52
Next, locate the largest value.
::下一个,找到最大的价值。86
Then, subtract the smallest value from the largest value.
::然后从最大值中减去最小值。86 - 52 = 34
The range is 34. The range of money raised by her family members is $34.
::范围是34,其家庭成员筹集的钱款范围是34美元。Example 2
::例2What is the range of this data set ?
::该数据集的范围是什么?First, locate the smallest value.
::首先,找到最小值。33
Next, locate the largest value.
::下一个,找到最大的价值。68
Then, subtract the smallest value from the largest value.
::然后从最大值中减去最小值。68 - 33 = 35
The range is 35.
::范围是35Example 3
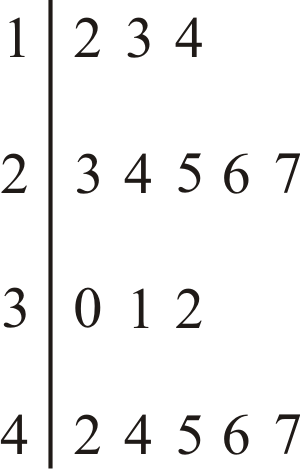
::例3Use the following stem-and-leaf plot to answer the question.
::使用以下干叶图解答问题。What is the range for this data set?
::此数据集的范围是什么 ?First, locate the smallest value.
::首先,找到最小值。12
Next, locate the largest value.
::下一个,找到最大的价值。47
Then, subtract the smallest value from the largest value.
::然后从最大值中减去最小值。47 - 12 = 35
The range is 35.
::范围是35Example 4
::例4Use the stem-and-leaf plot in example 3 to answer the question.
::使用例3中的干叶图解答问题。What is the range for the smallest interval ?
::最小间隔的范围是多少?First, list the intervals.
::首先,列出间隔。12-14, 23-27, 30-32, 42-47
Next, subtract the smallest number in the smallest interval from the largest number in the smallest interval.
::其次,从最小间隔中最大数字的最小间隔中减去最小间隔中最小的数字。14 - 12 = 2
Then, write the range for the smallest interval.
::然后写下最小间隔的范围 。2
The answer is 2. The smallest interval has a range of 2.
::答案是2. 最小的间隔范围为2。Example 5
::例5Use the stem-and-leaf plot in example 3 to answer the question.
::使用例3中的干叶图解答问题。What is the range of the greatest interval?
::最大间隔的范围是什么?First, list the intervals.
::首先,列出间隔。12-14, 23-27, 30-32, 42-47
Next, subtract the smallest number in the greatest interval from the largest number in the greatest interval.
::其次,从最大间隔中最大间隔中最小的间隔中减去最小的数字。47 - 42 = 5
Then, write the range for the smallest interval.
::然后写下最小间隔的范围 。5
The answer is 5. The greatest interval has a range of 5.
::答案是5. 最大间隔有5个范围。Review
::回顾Use each stem-and-leaf plot to answer the following questions.
::使用每个干叶图解答下列问题。Stem Leaf 6 8 7 5 7 9 8 0 2 9 2 6 6 7 -
What is the smallest value in the plot?
::地块中最小值是多少? -
What is the greatest value in the plot?
::阴谋的最大价值是什么? -
What is the range of the data?
::数据的范围是什么?
Stem Leaf 0 8 1 2 7 8 9 2 2 3 3 1 5 4 0 -
What is the smallest value in the data set?
::数据集中最小值是多少? -
What is the greatest value in the data set?
::数据集的最大价值是什么? -
What is the range of the data?
::数据的范围是什么? -
Name the first interval.
::命名第一个间隔 。 -
Name the second interval.
::命名第二个间隔 。 -
Name the third interval.
::命名第三个间隔 。 -
Name the fourth interval.
::命名第四个间隔 。 -
Which interval has the greatest number of values in it?
::哪个间距的值最大 ? -
Which interval has the fewest number of values in it?
::哪个间隔的值最少 ? -
Because the 4 stem has a zero in it, does that mean that there aren't any values in it?
::因为4个干柱里面是零, 是否意味着它没有任何价值? -
True or false. You can create a stem-and-leaf plot with a range in the hundreds.
::不管是真实的还是虚假的。你可以创造出一个有数百个射程的干叶图。 -
True or false. You can create a stem-and-leaf plot without using intervals.
::真实的或假的。您可以在不使用间隔的情况下创建干叶图 。
Review (Answers)
::回顾(答复)Click to see the answer key or go to the Table of Contents and click on the Answer Key under the 'Other Versions' option.
::单击可查看答题键, 或转到目录中, 单击“ 其他版本” 选项下的答题键 。Resources
::资源
-
What is the smallest value in the plot?