线性函数与非线性函数的区别
章节大纲
-
Dennis, the scorekeeper for the boys’ basketball team, has been keeping track of the team’s scoring during the weekend tournament. During the first two games, Dennis tracked the team’s shooting performance from different distances from the goal. He found that the team made approximately 50 percent of their shots when they were less than 10 feet from the goal. He also recorded their shooting averages from within 15, 20, and 25 feet of the goal. He displayed his results in the table below.
::男孩篮球队的记分员丹尼斯(Dennis)一直跟踪球队在周末比赛中的得分。 在前两场比赛中,丹尼斯从距离球门的不同距离跟踪球队的射击表现。 他发现球队在距离球门不到10英尺时拍了大约50%的球。 他还记录了球队在距离球门15、20和25英尺以内射击的平均数。 他在下面的表格中展示了他的成绩。10 50 15 40 20 30 25 20 Dennis wants to use this data to show that the team’s shooting average "> is dependent on the shooter’s distance from the goal .
::Dennis想用这些数据来显示球队的射击平均数取决于射手距离目标(x)的距离(x)。
In this concept, you will learn to distinguish between linear and non- by displaying these functions on a graph.
::在此概念中,您可以通过在图表中显示这些函数来学习区分线性函数和非线性函数。Distinguishing Between Linear and Non-Linear Functions
::线性函数和非线性函数的区分A linear function is a systematic or sequential increase or decrease represented by a straight line.
::线性函数是指由直线表示的系统或连续增减。Take a look at this table.
::看看这张桌子0 2 1 4 2 6 3 8 Notice that as the value increases the dependent or value increases in a sequential way or by 2 each time. This graph will form a straight line. To graph the equation , first arrange the and values into ordered pairs.
::请注意, 当 x 值以顺序方式或每次增加 2 增加依附值或 Y 值时, 此图将形成一条直线。 要绘制公式, 请先将 x 和 y 值排列为有顺序的对数 。(0, 2) (1, 4) (2, 6) (3, 8)
Then, plot the points on the graph to see if they connect in a straight line.
::然后绘制图表上的点,看它们是否连接在一条直线上。Here is the graph of this function .
::这是此函数的图形。Now, let’s take a look at the other type of function.
::现在,让我们来看看另一种功能。A non-linear function is a function where the data does not increase or decrease in a systematic or sequential way.
::非线性函数是指数据没有以系统或顺序方式增减的函数。In short, a non-linear function does not form a straight line when it is graphed.
::简言之,非线性函数在图形化时不构成直线。Let’s look at a non-linear function in a table.
::让我们在表格中查看一个非线性函数。1 3 2 5 3 4 4 9 In this table, the data does not move in a sequential way. The value increases (3 to 5), decreases (5 to 4) then increases again (4 to 9). This graph will not form a straight line.
::在本表中,数据不会以顺序方式移动。 y 值增加( 3 至 5) , y 值减少( 5 至 4) , 然后再次增加( 4 至 9) 。 此图不会形成直线 。Let’s graph this function to be sure. Here is the graph of a non-linear function.
::让我们来图形化这个函数以确认。这里是非线性函数的图形。You could connect these points, but it does not change the fact that this is a non-linear function.
::您可以连接这些点, 但这并不改变这个非线性函数的事实 。Examples
::实例Example 1
::例1Earlier, you were given a problem about the basketball team’s shooting percentage.
::更早之前, 篮球队的射击率问题就发生在你身上。Dennis wants to present his results to the coach and team. Here is the table with Dennis’s results.
::丹尼斯想向教练和团队介绍他的成绩。 这是丹尼斯的成绩表。10 50 15 40 20 30 25 20 How can Dennis use this information to determine if the relationship between shooting distance and shooting average is a linear or non-linear function?
::Dennis如何利用这一信息来确定射击距离与射击平均距离之间的关系是线性还是非线性功能?First, look at the chart and determine whether the dependent value increases or decreases sequentially as the value increases or decreases.
::首先,看看图表,确定依附 Y 值是随着x 值的增减而依次增减。Yes, the value decreases by 10 whenever the value increases by 5. This is in a sequence.
::是的, y 值在 x 值增加 5 时减少 10 。 这是按顺序排列的 。The answer is this pattern follows a linear rule. It will form a straight line when graphed. It is a linear function.
::答案是此模式遵循线性规则。 当图形显示时, 它会形成一条直线线。 它是一个线性函数 。Example 2
::例2Identify whether the table represents a linear or a non-linear function.
::确定表格是表示线性函数还是非线性函数。2 4 4 6 6 8 10 12 First, look at the chart and determine whether the dependent value increases or decreases sequentially as the value increases or decreases.
::首先,看看图表,确定依附 Y 值是随着x 值的增减而依次增减。Yes, the value increases by 2 whenever the value increases. This is in a sequence.
::是的, Y 值在 x 值增加时增加 2。 这是按顺序排列的 。The answer is this is a linear function. It will form a straight line when graphed.
::答案是,这是一个线性函数。在图形化时,它将形成一条直线。Example 3
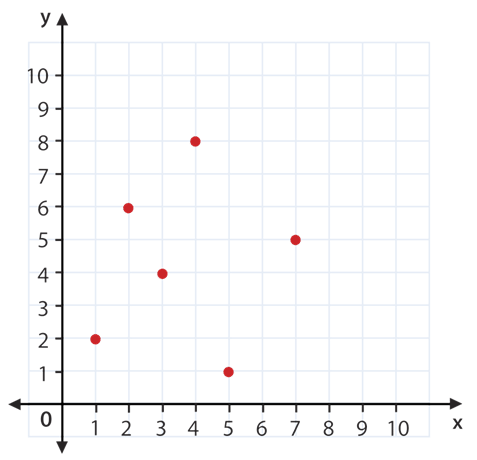
::例3Identify whether the graph represents a linear or a non-linear function.
::标明图形代表线性函数或非线性函数。First, look at the points on the graph.
::首先,看看图表上的点。Next, ask yourself “Can all the points be connected by one straight line?”
::接下来,请问您自己,“能否用一条直线连接所有点?”No, so this is a non-linear function.
::不,所以这是一个非线性函数。The answer is this is a non-linear function.
::答案是,这是一个非线性函数。Example 4
::例4Identify whether the table represents a linear or a non-linear function.
::确定表格是表示线性函数还是非线性函数。1 10 2 8 3 6 4 4 First, look at the chart and determine whether the dependent value increases or decreases sequentially as the value increases or decreases.
::首先,看看图表,确定依附 Y 值是随着x 值的增减而依次增减。Yes, the value decreases by 2 whenever the value increases by 1. This is in a sequence.
::是的, y 值在 x 值增加 1 时减少 2 。 这是按顺序排列的 。The answer is this pattern follows a linear rule. It will form a straight line when graphed. It is a linear function.
::答案是此模式遵循线性规则。 当图形显示时, 它会形成一条直线线。 它是一个线性函数 。Example 5
::例5Identify whether the table represents a linear or a non-linear function.
::确定表格是表示线性函数还是非线性函数。1 8 2 6 3 4 4 2 First, look at the chart and determine whether the dependent value increases or decreases sequentially as the value increases or decreases.
::首先,看看图表,确定依附 Y 值是随着x 值的增减而依次增减。Yes, the value decreases by 2 whenever the value increases. This is in a sequence.
::是的, y 值在 x 值增加时会减少 2。 这是按顺序排列的 。The answer is this is a linear function.
::答案是,这是一个线性函数。Review
::回顾Look at each table and determine whether the function is linear or non-linear.
::查看每个表格并确定函数是线性函数还是非线性函数。0 2 1 3 2 5 4 4 1 3 2 5 3 7 4 9 2 6 3 9 5 15 6 18 2 3 3 4 6 7 8 9 8 4 6 12 2 8 0 0 0 3 1 4 2 5 6 9 5 11 4 9 3 7 2 5 1 7 3 4 2 9 5 8 1 3 2 6 4 12 6 18 4 2 5 3 6 5 7 1 Now use each table in 1 – 10 and graph each function. You should have 10 graphs for this section. Number these graphs 11 – 20. If the graph is a linear graph, then please connect the points with a line.
::现在使用 1 - 10 中的每个表格, 并用图形显示每个函数 。 您应该为本节设置 10 个图表。 数这些图表 11 - 20. 如果图表是线性图表, 那么请将点与一行连接 。Review (Answers)
::回顾(答复)Click to see the answer key or go to the Table of Contents and click on the Answer Key under the 'Other Versions' option.
::单击可查看答题键, 或转到目录中, 单击“ 其他版本” 选项下的答题键 。Resources
::资源