图表函数
章节大纲
-
The students of the local high school are selling potted plants to raise funds for their soccer team to buy new uniforms. Each six-pack of potted plants will sell for $6.50. A new sports store has agreed to match the money raised by the students as a donation to the team. The money raised by the students will be displayed on a poster-size Cartesian graph and presented to the sports store. How can the students create such a graph?
::当地高中学生正在出售陶瓷工厂,为足球队募集资金购买新制服。每六包陶瓷工厂将出售6.50美元。一家新的体育商店同意将学生筹集的钱与团队捐款相匹配。学生筹集的钱将张贴在一张规模为卡提斯的海报图表上,并展示给体育商店。学生如何制作这样的图表?In this concept, you will learn to use tables to graph functions.
::在此概念中,您将学会用表格来图形函数。Graphing Functions
::图图函数Consider the following Cartesian graph that represents the equation .
::考虑以下表示y=3x+4方程式的笛卡尔图。The equation is written in function form and can be used to create a table of values that will make the statement of equality true. Remember an equation written in function form can be used to determine values for the output ‘ ’ based on the different input ‘ ’ values substituted into the equation.
::y= 3x+ 4 等式以函数形式写成, 可用于创建使平等声明真实化的数值表。 记住以函数形式写成的公式可以用来根据方程式中替代的不同输入 ' x ' 值来确定输出 'y ' 的值 。Using -values of -4, -2, 0, 2 and 4, create a table of values to represent the equation .
::使用 4 - 2, 0, 2 和 4 的 x 值, 创建一个数值表, 以代表 y= 3x+ 4 的方程式 。-4 -8 -2 -2 0 4 2 10 4 16
::x4y=3x+4y=3(- 4)+4Subtitution x4 进入方程式。y12+4 执行乘法以清除括号 y8 简化方程式的右侧 。Use this process to calculate the values of the output variable for each of the given input values.
::使用此进程计算每个给定输入值输出变量的值 。
::给定输入值 x% 2y= 3x+4y= 3(-2)+4y @ 6+4 输出值为 y2
::给定输入值 x=0y=3x+4y=3( 0)+4y=0+4=4 输出值为y=4
::给定输入值 x=2y=3x+4y=3(2)+4y=6+4 输出值为y=10
::给定输入值 x=4y=3x+4y=3(4)+4y=12+4 输出值为y=16The input value associated with the corresponding output value can be written as an ordered pair such that are the ordered pairs that can be plotted to represent the equation .
::与相应输出值相关的输入值可以写成一对定购对(x,y),这样(-4,8,(-2,-2),(2),(0),(8),(2),(2,10)和(4,16),即可以绘制成一对定购对以表示y=3x+4的公式。The ordered pairs are plotted on the Cartesian graph and are shown as red points. These points were then joined by a smooth straight line to draw the graph. The graph is a straight line such that the equation that produced this line was a linear function . The highest exponent of the variables of a linear function is one.
::定单对配方在笛卡尔图上绘制,以红点显示。然后将这些点用一条平滑的直线连接以绘制图形。该图是一条直线线,因此产生这条线的方程式是一个线性函数。线性函数变量的最大引号是一条。There are two special that produce a straight line graph. One of the straight lines is a vertical line that is parallel to the -axis and the other is a horizontal line that is parallel to the -axis.
::有两个特殊的直线图形。 其中一条直线是一条与 Y 轴平行的垂直线,另一条是一条与 X 轴平行的水平线。Let’s graph each of these special lines.
::让我们把这些特别的线条都图解一下。A line having as its equation will pass through the point such that it will be parallel to the -axis.
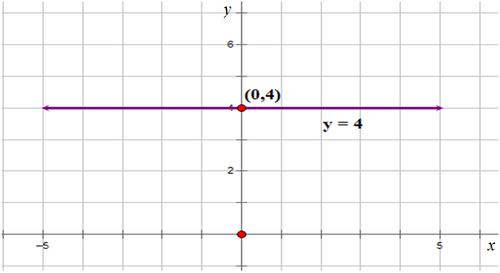
::直线x=5, 其方程将穿过点( 5,0) , 从而与 Y 轴平行 。A line having as its equation will pass through the point such that it will be parallel to the -axis.
::以 y=4 为方程式的线将穿过点( 0, 4), 使其与 X 轴平行 。Examples
::实例Example 1
::例1Earlier, you were given a problem about the plotted plants and the soccer uniforms.
::早些时候,有人给了你一个问题 有关布置的植物和足球制服。The students need to create a poster size graph to show how much money was raised. How can the students create this graph?
::学生们需要创建海报大小图,以显示筹集了多少钱。 学生们如何创建这个图?They can create a table of values and plot the ordered pairs from the table.
::他们可以创建一个数值表,并从表中绘制一对定购的配对。First, write an equation in function form to represent the sale of potted plants.
::首先,以功能形式写一个方程,表示出售陶工厂。Let represent the money raises and let represent the number of potted plants sold.
::让x代表出售的陶工厂的数量。
::y=6. 50xNext, create a table of values and use the equation expressed in function form to calculate the output value for each input value.
::下一步,创建一个数值表,并使用以函数格式表示的方程式计算每个输入值的输出值。50 100 150 200 250
::x=50y = 6. 50xy = 6. 50( 50) 等式中的替代 x= 50.y = 325. 00 进行乘法以清除括号。Repeat the same process for the remaining input values.
::对剩余输入值重复相同的进程 。
::给定输入值 x= 100y= 6. 50xy= 6. 50( 100) 输出值为y= 650.00
::给定输入值 x=150y=6. 50xy=6. 50(150) 输出值为y= 975. 00
::给定输入值 x=200y=6. 50xy=6. 50(200) 输出值为y=1300.00
::给定输入值 x= 250y= 6. 50xy= 6. 50(250) 输出值为 y= 1625. 00Next, write the calculated ‘ ’ values in the table.
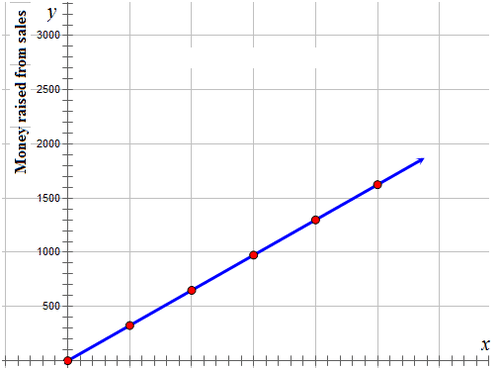
::下一步,在表格中填入计算中的 'y ' 值。50 325 100 650 150 975 200 1300 250 1625 Then, plot the ordered pairs shown in the table on a Cartesian grid.
::然后,在笛卡尔网格上绘制桌子上显示的两对定购的配对。The sports store will have to match the $1,625.00 raised by the students.
::体育商店将须与学生筹集的1 625.00美元相匹配。Example 2
::例2For the following linear function written in function form, complete the table of values and plot the graph.
::对于以函数形式写成的以下线性函数,填写数值表并绘制图表。
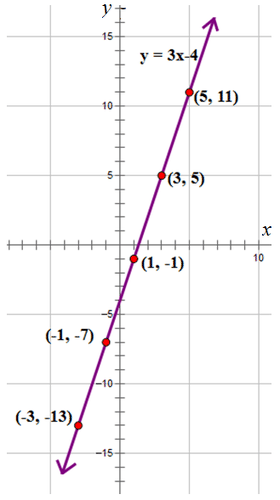
::y=3x- 4 y-3 -13 -1 -7 1 -1 3 5 5 11 First, use the equation to calculate the output values ‘ .’
::首先,使用方程式计算输出值“y.”
::x3y= 3x-4y= 3(-3)- 4Subtitution x3 进入方程式。 y9- 4 进行乘法以清除括号。 y13 简化方程式的右侧 。Repeat the process to calculate the values for the variable ‘ .’
::重复计算变量“y.”的值的过程
::给定输入值 x% 1y= 3x- 4y= 3( - 1) - 4y_ 3- 4) 输出值为 y 7
::给定输入值 x=1y=3x- 4y=3(1)- 4y=3- 4y=3- 4 输出值为 y1
::给定输入值 x= 3y= 3x- 4y= 3(3)--4y= 9- 4y= 9- 4 输出值为 y= 5
::给定输入值 x= 5y= 3x- 4y= 3(5)- - 4y= 15- 4 输出值为 Y= 11Write the calculated ‘ ’ values in the table.
::在表格中写入计算中的 'y ' 值。Plot the ordered pairs on the Cartesian grid and join the plotted points with a smooth, straight line.
::在笛卡尔网格上标定的一对配对,用平滑的直线加入绘图点。Example 3
::例3For the following linear function create a table of values and plot the points to draw the graph:
::对于以下线性函数,将创建一个数值表,并绘制绘制图形的点数:
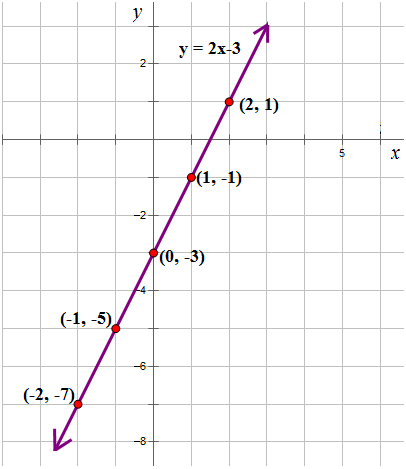
::y=2x-3First, use the equation to calculate the output values ‘ .’
::首先,使用方程式计算输出值“y.”
::x2y=2x-3y=2-2-3Subtitution x2 进入方程式。y4-3 执行乘法清除括号。y7 简化方程式的右侧。Repeat the process to calculate the values for the variable ‘ .’
::重复计算变量“y.”的值的过程
::给定输入值 x% 1y= 2x- 3y= 2( - 1) - 3y}% 2 - 3 输出值为 y 5
::给定输入值 x=0y=2x-3y=2(0)--3y=0- 3 输出值为 y3
::给定输入值 x=1y=2x-3y=2(1)--3y=2- 3y=3 输出值为 y1
::给定输入值 x=2y=2x- 3y=2 (2)--3y=4- 3 输出值为y=1Write the calculated ‘ ’ values in the table.
::在表格中写入计算中的 'y ' 值。-2 -7 -1 -5 0 -3 1 -1 2 1 Plot the ordered pairs on the Cartesian grid and join the plotted points with a smooth, straight line.
::在笛卡尔网格上标定的一对配对,用平滑的直线加入绘图点。Example 4
::例4Plot the graph of the line having as its equation.
::绘制以 x2 为其方程的线条图 。First, remember this is the graph of one of the special lines.
::首先,请记住,这是其中一条特别线的图示。Next, describe what the graph will look like.
::接下来,请描述图表的外观。A vertical line passing through the point and parallel to the -axis.
::垂直线穿过点(-2,0),与 Y 轴平行。Then, graph the line on the Cartesian grid.
::然后在笛卡尔电网上绘制线条图Example 5
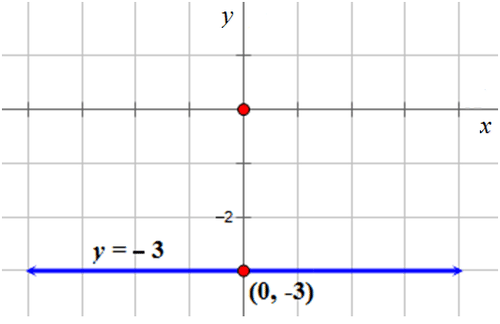
::例5Plot the graph of the line having as its equation.
::绘制以 y3 为方程的线条图 。First, remember this is the graph of one of the special lines.
::首先,请记住,这是其中一条特别线的图示。Next, describe what the graph will look like.
::接下来,请描述图表的外观。A horizontal line passing through the point and parallel to the -axis.
::水平线穿过点(0,-3),与 X 轴平行。Then, graph the line on the Cartesian grid.
::然后在笛卡尔电网上绘制线条图Review
::回顾Create a table of values for each equation and then graph it on the coordinate plane.
::创建每个方程式的数值表,然后在坐标平面上绘制图表。-
::y=2x+1 y=2x+1 -
::y=3x+2 y=3x+2 -
::y4x -
::y2x -
::y3x+3 y3x+3 -
::y=2x+3 y=2x+3 -
::y=3x-2 -
::y8x -
::y=3x+1 y=3x+1 -
::y=4x y=4x -
::y2x+2 -
::y=2x-2 -
::y=x-1 -
::x=4x=4 -
::y2
Review (Answers)
::回顾(答复)Click to see the answer key or go to the Table of Contents and click on the Answer Key under the 'Other Versions' option.
::单击可查看答题键, 或转到目录中, 单击“ 其他版本” 选项下的答题键 。 -