插盒和口述口语笔
章节大纲
-
A track and field coach, Mr. Watson was measuring shot put distances for his varsity and junior varsity teams. Here is his data , in feet, that he put in order from least to greatest.
::华生先生是一位田径和田径教练,他正在测量他的大学和初级大学队的距离。 这是他从最少到最多排列的数据。Varsity:
::差异 :36.8, 43.5, 45.8, 46.2, 49.1, 50.7, 52.7, 54.3, 54.4, 55.8, 56.0, 58.5
Junior Varsity:
::低年级:33.2, 35.4, 36.2, 37.0, 37.6, 39.4, 40.6, 40.8, 41.3, 42.1, 44.5, 50.3
Mr. Watson wants to present this information to both of his teams. He wants to compare them. How can Mr. Watson create a display that will communicate what he wants to tell his team?
::Watson先生想向两组人介绍这个信息 他想比较他们In this concept, you will learn to create box-and-whisker plots.
::在这个概念中,你会学会 创建纸箱和口述的地块。Box and Whisker Plots
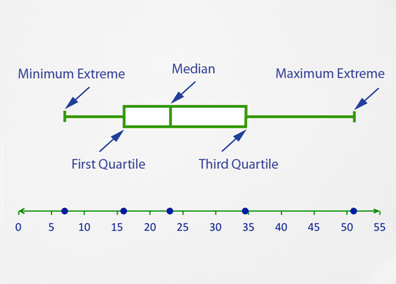
::插箱和口述口语笔At times it is useful to get a general idea of how data clusters together. Box-and-whisker plots display the distribution of data items along a number line. The data are divided into four equal parts, separated by points called quartiles . A box-and-whisker plot also displays the smallest data point (the extreme minimum) and the largest data point (the extreme maximum).
::有时,了解数据组的组合方式是有用的。 框- 键- 键- 键图显示数据项目在数字行的分布。 数据分为四个相等部分, 由四分位( 称为四分位 ) 分隔。 框- 键- 键的图也显示最小的数据点( 最小值) 和最大数据点( 最大值 ) 。A box-and-whisker plot is created by determining five points. This is called a five-point summary .
::通过确定 5 个点来创建一个框和短片图。 这称为五点摘要 。First, place the data in order from smallest to largest.
::首先,将数据按最小到最大顺序排列。Next, create a number line that shows the range of the data using equal intervals. The will be used as the middle point on the box-and-whisker plot and to split the data in half.
::下一步, 创建一个数字行, 用相等的间隔来显示数据范围。 该数字行将用作框和断层图的中点, 并将数据拆分一半 。Next, the median of each half, the quartile , is then calculated. These separate the data into quarters.
::然后计算每一半的中位数,即四分位数。数据按季度分列。Then, use the highest data point and the lowest data point as the endpoints or extremes . Boxes are drawn between the quartiles, and whiskers are drawn to the extremes.
::然后,使用最高数据点和最低数据点作为终点或极端。框在四面形之间绘制,胡须则被吸引到极端。Now let’s apply these steps to an example.
::现在让我们把这些步骤应用到一个例子上。In this example, each step will be shown. Later all of the data for the box-and-whisker will be used to draw the graph.
::在此示例中, 将显示每个步骤 。 稍后, 框和提示的所有数据都将用于绘制图形 。Draw a box-and-whisker plot for the given data.
::为给定数据绘制一个框和划线图 。16, 51, 32, 16, 24, 37, 7, 22, 19, 40, 10, 31, 29, 38, 21, 11
First, put the data in order from smallest to largest.
::首先,将数据从最小到最大排列顺序。7, 10, 11, 16, 16, 19, 21, 22, 24, 29, 31, 32, 37, 38, 40, 51
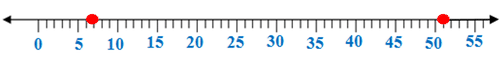
Next, draw a number line that includes the extremes, 7 and 51. In this case, use a number line from 5 to 55 using intervals of 5.
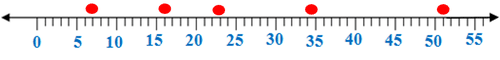
::接下来,绘制一个包括极端、7和51的编号线,在此情况下,使用5至55的编号线,间隔为5。Then, determine the median of the data. The middle points in the data are 22 and 24 so the median is 23. Mark the median with a point beneath the number line.
::然后,确定数据的中位数。数据中的中点是22和24,中间点是23,中间点是23,标记中位数,标出数字线下方的点数。Then, the median separates the data into two groups as shown below:
::然后,中位数将数据分为两类,如下所示:7, 10, 11, 16, 16, 19, 21, 22 24, 29, 31, 32, 37, 38, 40, 51
Find the median of each of these groups. These medians are the quartiles which are 16 and 34.5. These divide the data into four groups. Mark the quartiles as you did the median, with a point.
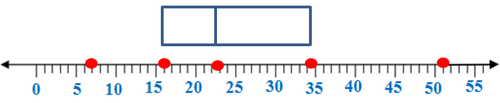
::查找其中每一组的中位数。 这些中位数是四分位数, 分别为 16 和 34 5 。 它们将数据分为四组 。 标记四分位数, 与您所做的中位数一样, 加上一个点 。Then, draw boxes between the quartiles and the median.
::然后在四分位数和中位数之间画个盒子Then, mark the extremes, the smallest and largest numbers, with points. In this case, the extremes are 7 and 51.
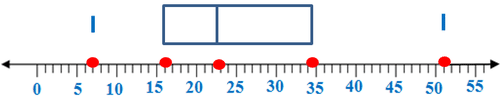
::然后,用点数标记极端, 最小和最大的数字, 并标出点数。 在这种情况下, 极端是7和51。Then, draw whiskers, or horizontal lines, to connect the quartiles to the extremes.
::然后绘制胡须或水平线, 将四面体与极端联系起来。It can be seen from the box-and-whisker plot that half of the data will be found between the first quartile and the third quartile . A quarter of the data is between the minimum and the first quartile and the last quarter is between the third quartile and the maximum . The median, of course, marks the half-way point between the data.
::从方框和小费图中可以看出,数据的一半将在第一个四分位数和第三个四分位数之间找到。四分之一的数据在最小和第一个四分位数之间,最后四分之一的数据在第三个四分位数和最高之间。当然,中位数是数据之间的中点。In this particular situation, the second half of the data is stretched out over a further area than the first half and about half way is between 15 and 35.
::在这种特殊情况下,数据后半部分扩展至比前半半个和大约半个区域(15至35个之间)更远的地区。Double plots or graphs can be made when there are two factors being compared. A can be made by drawing the second factor beneath the first factor. This will allow both factors to be visible on the same plot.
::在比较两个因素时可以绘制双倍图或图形。 A 可以通过在第一个因素下方绘制第二个因素来绘制。 这样可以在同一因素上看到两个因素。Examples
::实例Example 1
::例1Earlier, you were given a problem about the coach and the shot put distances. The coach’s data, in feet, for the shot put distances that he put in order from least to greatest are:
::早些时候,有人给了你关于教练和射击距离的问题。 教练的脚足数据显示,他的射击距离从最少到最多不等:Varsity:
::差异 :36.8, 43.5, 45.8, 46.2, 49.1, 50.7, 52.7, 54.3, 54.4, 55.8, 56.0, 58.5
Junior Varsity:
::低年级:33.2, 35.4, 36.2, 37.0, 37.6, 39.4, 40.6, 40.8, 41.3, 42.1, 44.5, 50.3
Make a double box-and-whisker plot of this data. How does the data compare?
::将此数据做成一个双箱和简略的图。 数据是如何比较的 ?First, find the minimum, maximum, median, and the first and third quartiles for each set of data. These will give you the five-point summary for both the varsity and junior varsity teams.
::首先,找到每组数据的最小值、最大值、中位数以及第一和第二四位数。 这将为您提供五点摘要, 供您使用, 包括大学和初级大学团队 。Varsity Junior Varsity Minimum extreme 36.8 33.2 Maximum extreme 58.5 50.3 Median 51.7 40.0 First Quartile 46.0 36.6 Third Quartile 55.1 41.7 Next, draw the double box-and-whisker plot.
::下一位,画个两盒和口哨的图案Then, analyze the double box-and-whisker plot.
::然后,分析 双箱和耳语的图案。From this box-and-whisker plot, the coach can tell that the team’s results are what he expected. The varsity shot put distances are generally better than those of the junior varsity. There are a number of players whose results overlap. The highest junior varsity player is better than the entire first quartile of the varsity team. It is also apparent that the results are more dispersed, or spread out, in the varsity team than in the junior varsity team.
::教练可以从这个黑盒和小插曲的情节中看出,球队的成绩是他所期望的。 球队的阵势距离一般优于小队的阵势距离。 有许多球员的比赛结果重叠。 最高小队的队势优于整个队形的四分之一。 同样明显的是,球队的阵势比小队的阵势更加分散或分散。Example 2
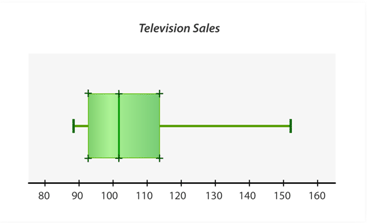
::例2The data values below depict the number of televisions sold at a department store each month for nine months. Create a box-and-whisker plot to display the data.
::下面的数据值显示每月在百货商店售出的电视机数量,共9个月。 创建一个插盒和短消息图以显示数据 。April May June July August September October November December 110 98 91 102 89 95 108 118 152 First, to determine the median of the set of data, arrange the data in order from least to greatest. Identify the data value in the middle of the data set .
::首先,确定数据集的中位数,将数据排列为从最小到最大。在数据集中间确定数据值。89, 91, 95, 98, 102, 108, 110, 118, 152
For this set of data, 102 is the median.
::就这组数据而言,102是中位数。Next, identify the median for the lower quartile . Again, since two data values share the middle position, find their mean.
::接下来,确定下四分位的中位值。再次,由于两个数据值的中间位置相同,发现它们的平均值。89, 91, 95, 98, 102, 108, 110, 118, 152
The median for the lower quartile is .
::下四分位的中位数为91+952=93。Then, identify the median of the upper quartile . Remember to find the mean of the two data values that share the middle position.
::然后, 确定上四分位的中位值。 记住要找到两个数据值的平均值, 这两个数据值的中位值与中位值相同 。The median of the upper quartile is .
::上四分位的中位数为110+1182=114。Then, draw a number line. The first value on the number line should be near the smallest number in the data set. In this case, the smallest number is 89. Therefore, the number line will start at 80. The last value on the number line should be near the largest number in the set of data. The largest number in the data set is 152. Therefore, the number line will end at 160. In this case, label the number line by tens.
::然后,绘制一个数字行。数字行的第一个值应接近数据集中最小的数字。在这种情况下,最小的数字是89。因此,数字行将从80开始,数字行的最后值应接近数据集中最大的数字。数据集中最大的数字是152。因此,数字行将结束于160。在这种情况下,将数字行标为10。Use this box-and-whisker plot to answer the following questions.
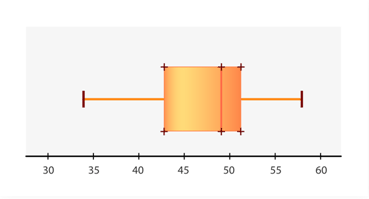
::使用此纸箱和私语图解答下列问题 。Example 3
::例3What is the minimum extreme of this box-and-whisker plot?
::最起码的极端是什么 这个盒子和口哨的阴谋?The answer is 34.
::答案是34岁The minimum extreme is the point furthest to the left which is 34.
::最起码的极端是左偏最远的点,即34。Example 4
::例4What is the maximum extreme of this box-and-whisker plot?
::这个盒子和口哨的阴谋 最极端的是什么?The answer is 58.
::答案是58岁The maximum extreme is the point furthest to the right which is 58.
::最大极限是距离58号右转最远的点。Example 5
::例5What is the median?
::中位数是多少?The answer is 49.
::答案是49个The median is the middle value found where the line lies in the box of the box-and-whisker which is 49.
::中位值是中值, 线位于49的盒子和口哨框中, 中间值为49 。Review
::回顾Use each data for each set of instructions.
::使用每套指示的每套数据。90, 104, 98, 156, 140, 85, 122, 129, 142, 138, 131, 81, 151, 147, 130, 156
1. Create a box-and-whisker plot for the data.
::1. 为数据建立一个纸箱和口述图。2. Identify the minimum extreme.
::2. 确定最起码的极端。3. Identify the maximum extreme.
::3. 确定最大极端。4. Identify the median.
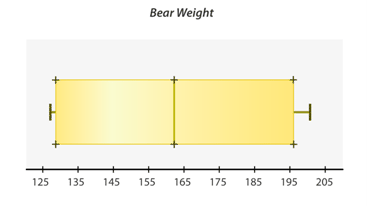
::4. 确定中位数。The weight of bears varies between species. Weight also varies within species as a result of habitat and diet. The box-and-whisker plot was created after recording the weight (in pounds) of several black bears across the country. Use the box-and-whisker to estimate your answers to the questions below.
::熊的重量因物种而异。由于生境和饮食原因,不同物种的重量也不同。 盒子和口哨图是在记录了全国数只黑熊的重量(磅)之后产生的。 使用盒子和口哨来估计你对下面问题的答复。5. What is the minimum extreme?
::5. 最起码的极端是什么?6. What is the maximum extreme?
::6. 最大极端是什么?7. What is the median?
::7. 中位数是多少?8. What is the value of the first quartile?
::8. 第一个四分位数的价值是什么?9. What is the value of the third quartile?
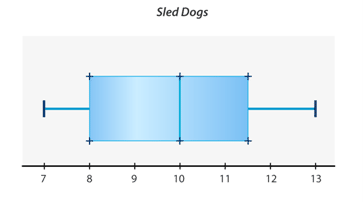
::9. 第三个四分位数的价值是什么?A group of dog sled drivers collected the following data about the number of dogs who lead sled teams. Here is the data in a box-and-whisker plot.
::一群狗滑雪车司机收集了以下关于领导滑雪队的狗数量的数据,这是一个盒子和脚印图中的数据。10. What is the minimum extreme?
::10. 最起码的极端是什么?11. What is the maximum extreme?
::11. 最大极端是什么?12. What is the median?
::12. 中位数是多少?13. What is the value of the first quartile?
::13. 第一个四分位数的价值是什么?14. What is the value of the third quartile?
::14. 第三个四分位数的价值是什么?15. How many dogs do most sled teams have?
::15. 大多数雪橇队有多少只狗?Review (Answers)
::回顾(答复)Click to see the answer key or go to the Table of Contents and click on the Answer Key under the 'Other Versions' option.
::单击可查看答题键, 或转到目录中, 单击“ 其他版本” 选项下的答题键 。