理解帕拉波拉图
章节大纲
-
The students in Mr. Nelson’s class went on a tour of downtown. While they were seeing the sights, they were also learning about the city that they live in. The students reached the park and stopped at the entrance. The entrance to the park was a beautiful arc decorated with ivy and flowering vines.
::Nelson先生班的学生在市中心巡视,在看到景色时,他们也正在了解他们所居住的城市,学生们来到公园,停在入口处,公园入口处是一座漂亮的弧形弧形,上面装饰有藤藤和花葡萄。“This is beautiful,” Kelsey said looking at the entrance.
::Kelsey说,“这是美丽的,”看着入口。“It sure is. It looks like a parabola ,” Kenny commented.
::肯尼评论道,“A parabola?” Kelsey exclaimed.
::“抛物线?” Kelsey发言。How can Kenny explain a parabola to Kelsey?
::肯尼怎么向凯尔西解释抛物线?In this concept, you will learn to understand the graphs of a parabola given equations.
::在此概念中, 您将学会理解 抛物线给定方程的图形 。Parabola
::帕拉波拉Graphs and equations are important parts of mathematics. Equations can show relationships between different variables, like and . Graphs can show all of the pairs of numbers, and , that make an equation true—they show all of the solutions. Oftentimes, graphs represent infinite pairs of such numbers.
::图形和方程式是数学的重要部分。 方程式可以显示不同变量之间的关系, 如 x 和 y 。 图形可以显示使方程式真实的所有数字对, x 和 y , 它们可以显示所有解决方案。 通常, 图形代表无限数字对 。Not all graphs will be linear. Some graphs are shaped like U’s. These U-shaped graphs are called parabolas . A parabola is a graph of a quadratic function . So instead of graphing which forms a linear graph, parabolas are graphs of function like . Look at the graph below that shows the difference in appearance of these two functions.
::并非所有的图形都是线性。 有些图形形状与 U 相似。 这些U形图形被称为parapolas。 一个 parbola 是二次函数的图形。 因此, parapolas 并不是像 y=x+4 那样绘制成线性图形的 y=x+4, 而是像 y=x2+4 一样的函数图。 请看看下面显示这两个函数外观差异的图表 。Let’s try an example where you can graph a parabola.
::让我们尝试一个示例, 这样您就可以绘制抛物线图 。Graph .
::图y=x2。First, start by filling in a table of values. Look at the table below. The -values are listed from -3 to +3. Use these values to find the corresponding -values. It is not necessary to use these -values but most of the time; they will work with the parabolas being graphed.
::首先,先填入一个数值表。看看下面的表格。 X 值从 - 3 到 +3 列表。 x 值从 - 3 到 +3 列表。 使用这些值查找相应的 y 值。 没有必要使用这些 x 值,而是大部分时间使用; 它们会与正在绘制的 parabolas 一起工作 。When filling out the table, simply put the -value into the equation . For example, when or .
::填写表格时, 只要将 X 值放入公式 y=x2 。 例如, 当 x3, y= (- 3) 2 或 y=9 时 。Next, graph the values on the coordinate plane .
::下一位请绘制坐标平面上的数值图。Look at the difference in the graph. This shape is called a parabola. Equations to the 2 nd power are called quadratic equations and their graphs are always parabolas.
::查看图形中的差别。 这个形状被称为抛物线。 与第二电源的方程式被称为二次方程, 它们的图形总是parapolas 。Let’s look at another example.
::让我们再看看另一个例子。Graph .
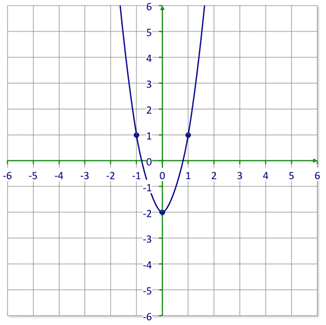
::图y=x2-2。First, start by filling in a table of values. Look at the table below. The -values are listed from -3 to +3. Use these values to find the corresponding -values.
::首先,先填入一个数值表。看看下面的表格。 X 值从 -3 到 +3 列出。使用这些数值查找相应的 Y 值。When filling out the table, simply put the -value into the equation . For example, when or .
::填写表格时,只需将x值 y=x2-2 。 例如, 当 x3,y=x2 - 2,y(- 3)2 - 2 或y= 7 时, 只需将 x 值放入等式 y=x2 - 2 。Next, graph the values on the coordinate plane.
::下一位请绘制坐标平面上的数值图。The shape is the same but it moves down two points on the y-axis . This is because of the constant -2.
::形状是相同的,但它在 Y 轴上向下移动两点。这是因为常数 - 2 。Let’s try one more example.
::让我们再举一个例子。Graph .
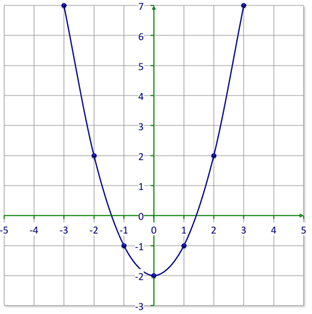
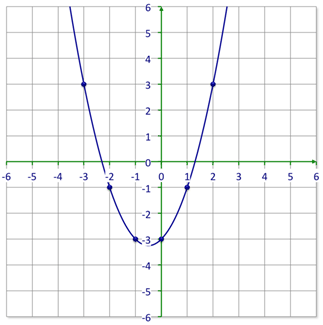
::图y=x2-4。First, start by filling in a table of values. Look at the table below. The -values are listed from -3 to +3. Use these to find the corresponding -values.
::首先,首先填入一个数值表。看看下面的表格。 X 值从 -3 到 +3 列出。使用这些来查找相应的 y 值 。When filling out the table, simply put the -value into the equation . For example, when or .
::填入表格时,只需将 X 值 y=x2-4 的公式中输入 y=x2-4。例如,当 x3,y=x2-4,y=(- 3)2-4或y=5 时。Next, graph the values on the coordinate plane.
::下一位请绘制坐标平面上的数值图。Examples
::实例Example 1
::例1Earlier, you were given a problem about Kenny and the parabola. He wants to describe the meaning of parabola to Kelsey.
::早些时候,有人给了你一个肯尼和抛物线的疑问, 他想向凯尔西描述抛物线的含义。A parabola is the shape that is created by a quadratic equation . It forms an arc. A parabola has a vertex that is either a maximum point or a minimum point.
::抛物线是二次方程所创造的形状。它组成弧。抛物线有一个顶点,要么是最大点,要么是最小点。If the squared value is positive then the parabola opens upward and therefore has a minimum point. If the squared value is negative then the parabola opens downward and therefore has a maximum point.
::如果正方形值为正数,则抛物线向上打开,因此有一个最小点。如果正方形值为负数,则抛物线向下打开,因此有一个最大点。Example 2
::例2Create the graph of .
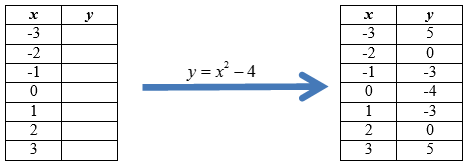
::创建 yx2 的图形。First, start by filling in a table of values. Look at the table below. The -values are listed from -3 to +3. Use these to find the corresponding -values.
::首先,首先填入一个数值表。看看下面的表格。 X 值从 -3 到 +3 列出。使用这些来查找相应的 y 值 。When filling out the table, simply put the -value into the equation . For example, when . or .
::填写表格时, 只要将 X 值放入等式 yx2. 例如, 当 x3. yx2, y2 (- 3) 2 或 y9 时 。Next, graph the values on the coordinate plane.
::下一位请绘制坐标平面上的数值图。This time the graph is inverted. Instead of opening upwards, it opens downward. This is because of the coefficient -1.
::这一次图形被倒转。 它不是向上打开, 而是向下打开。 这是因为系数 - 1 。For these three examples, work with the quadratic function .
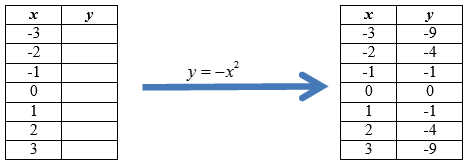
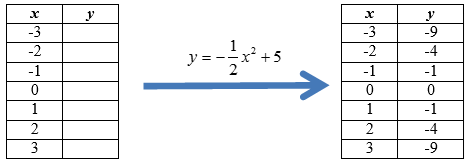
::就这三个例子而言,与四方函数 y12x2+5合作。Example 3
::例3First, create the t-table.
::首先,创建t-table。Example 4
::例4Next, graph the parabola for the quadratic function .
::下图“ y12x2+5” 二次函数的抛物线。Example 5
::例5Where is the vertex of this parabola?
::这个抛物线的顶点在哪里?The vertex is the turning point of the curve. Parabolas are symmetrical , and this one could really be folded along the -axis at the vertex point to create two identical halves.
::顶点是曲线的转折点。 Parabolas 是对称的, 这个可以沿着 y 轴在顶点折叠, 以创造两个相同的半径 。The vertex occurs at the point (0, 5).
::顶点发生于点(0, 5) 。Review
::回顾Answer the following questions about parabolas.
::回答下列关于parabolas的问题。1. True or false. A parabola is always formed by a quadratic equation.
::1. 真实的或虚假的,抛物线总是由二次方程形成。2. True or false. A parabola can have a vertex that is positive or negative.
::2. 真实或虚假:抛物线可有一个正或负的顶点。3. True or false. If the vertex is positive, then the parabola will be located above the -axis.
::3. 真实或虚假:如果顶部呈阳性,则抛物线将位于X轴之上。4. True or false. If the vertex is negative, then the vertex will be below the -axis.
::4. 正确或虚假:如果顶部为负,则顶部在X轴下方。5. True or false. All parabolas are symmetrical.
::5. 真实的或虚假的,所有抛物线都是对称的。Match the three graphs to their quadratic equations.
::将三个图形和他们的二次方程匹配。6.
::6.y=3x2-27.
::7. y=x2+x-38.
::8. y12x2+2Graph A
::图A 图AGraph B
::图B 图BGraph C
::图C CNow answer these questions about the graphs.
::现在回答这些关于图表的问题。9. What is the vertex of graph A?
::9. 图A的顶点是什么?10. What is the vertex of graph B?
::10. 图B的顶点是什么?11. What is the vertex of graph C?
::11. 图C的顶点是什么?12. Which graph is the narrowest graph?
::12. 哪个图是最狭窄的图?Graph the following equations using a t-table:
::用t表绘制下列方程图:13.
::13. y=x2-114.
::14. yx2+x15.
::15.y=12x2+1Review (Answers)
::回顾(答复)Click to see the answer key or go to the Table of Contents and click on the Answer Key under the 'Other Versions' option.
::单击可查看答题键, 或转到目录中, 单击“ 其他版本” 选项下的答题键 。