指数函数
章节大纲
-
In a laboratory, one strain of bacteria can double in number every 15 minutes. Suppose a culture starts with 60 cells, use your graphing calculator or a table of values to show the sample’s growth after 2 hours. Use the function where is the number of cells after q quarter hours.
::在实验室里,细菌菌株每15分钟可以翻一番。 如果培养以60个细胞开始,则使用你的图形计算器或数值表来显示样本在2小时后的增长。使用函数 b=60x2q where b 是 q 四分之一 小时后的细胞数量。In this concept, you will learn to recognize, evaluate and graph .
::在这一概念中,你将学会认识、评价和图表。Exponential Functions
::指数函数An exponential function is any function that can be written in the form , where and are constants , and
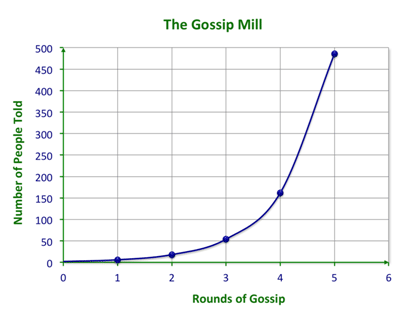
::指数函数是指以 y=abx 形式写出的任何函数,其中a和b为常数sa=0,b>0,和b=1。Two girls in a small town once shared a secret, just between the two of them. They couldn’t stand it though, and each of them told three friends. Of course, their friends couldn’t keep secrets, either, and each of them told three of their friends. Those friends told three friends, and those friends told three friends, and so on... and pretty soon the whole town knew the secret. There was nobody else to tell!
::在一个小镇上,两个女孩曾经分享了一个秘密,只是两个女孩之间的秘密。她们无法忍受这个秘密,他们每个人都告诉了三个朋友。 当然,她们的朋友也不能保守秘密,他们每个人都告诉了三个朋友。 这些朋友告诉了三个朋友,而那些朋友告诉了三个朋友,等等。 很快,整个城镇就知道了这个秘密。 没有人可以透露了!These girls experienced the startling effects of an exponential function. If you start with the two girls who each told three friends, you can see that they told six people or . Those six people each told three others, so that or . They told 18 people. Those 18 people each told 3, so that now is or or 54 people.
::这些女孩经历了指数函数的惊人效应,如果从两个女孩开始,她们分别告诉三个朋友,你可以看到她们告诉六个人或者2×3;这六个人告诉另外三个人,然后是6×3或者2×3×3;他们告诉18人,这18人告诉3,现在是18×3或者2×3×3;或者54人。You can see how this is growing and you could show the number of people told in each round of gossip with a function: where is the number of people told, is the two girls who started the gossip, is the number of friends that they each told, and is the number of rounds of gossip that occurred.
::你可以看到这种情况是如何增加的, 你可以显示每轮八卦中讲到的人数, 并显示一个功能:y=abx, 其中y是被讲到的人数, a是两个女孩开始说八卦, b是她们每个告诉朋友的人数, x是发生的八卦次数。You could make a table of values and calculate the number of people told after each round of gossip. Use the function where is the number of people told and is the number of rounds of gossip that occurred.
::您可以绘制一个数值表, 计算每轮八卦后告知的人数。 使用 y=2x3x 函数, 其中 y 是被告知的人数, x 是 发生八卦的次数 。rounds of gossip 0 1 2 3 4 5 people told 2 6 18 54 162 486 Next, graph the relationship between the rounds of gossip and the number of people told.
::下一张图表,说明八卦与所报道人数之间的关系。How can you tell if a function is an exponential function?
::您如何知道函数是否是一个指数函数?If your function can be written in the form , where and are constants, , and , then it must be exponential. In quadratic equations, your functions were always to the 2 nd power. In exponential functions, the exponent is a variable . Their graphs will have a characteristic curve either upward or downward.
::如果您的函数可以以 y=abx 的形式写成, 其中 a 和 b 是常数, a0, b>0, 和 b1, 那么它必须是指数。 在二次方程式中, 您的函数总是为第2次功率。 在指数函数中, 引号是一个变量。 它们的图形将有一个向上或向下的特征曲线 。Let’s look at some examples of exponential functions.
::让我们看看指数函数的一些例子。-
::y=2x y=2x -
::c=4×10a = 4×10a -
::y=2x( 23) x -
::t=4×10y
Now, here are some examples that are not exponential functions
::现在,这里有一些非指数函数的例子-
because
.
::y=3x1x 因为 b=1 。 -
because
.
::n=0×3p 因为 a=0。 -
because
.
::y=( - 4) x 因为 b < 0 。 -
because
.
::y6×0x 是因为 b1 。
Exponential functions can be graphed by using a table of values like you did for quadratic functions. Substitute values for and calculate the corresponding values for .
::指数函数可以通过使用一个数值表来绘制图表,和你对二次函数所做的相同。 x 的替代值,并计算y 的相应值。Let’s look at an example.
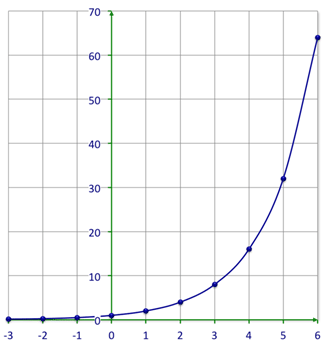
::让我们举个例子。Graph .
::图y=2x。First, fill in the table of values.
::首先,填写数值表。Next, graph the function.
::下一位, 绘制函数图 。Notice that the shapes of the graphs are not parabolic like the . Also, as the value gets lower and lower, the value approaches zero but never reaches it. As the value gets even smaller, the value may get infinitely close to zero but will never cross the -axis.
::请注意, 图形的形状不像 。 另外, 随着 x 值越来越低, Y 值接近零, 却从未达到。 随着 x 值变得更小, y 值可能远近于零, 却永远不会越过 x 轴 。Examples
::实例Example 1
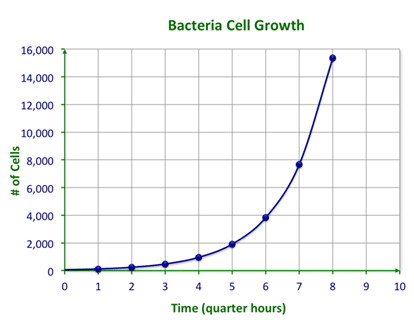
::例1Earlier, you were given a problem about the scientists and the bacteria. The scientists are studying a strain of bacteria that doubles in number every 15 minutes. The function represents the growth rate of the bacteria where is the number of cells there are after quarter hours.
::早些时候,有人给了你一个关于科学家和细菌的问题。 科学家们正在研究一种细菌菌株, 每15分钟翻一番。 函数 b=60x2q 代表细菌的生长速度, 其中 b 是 q 25 小时后的细胞数 。First, create a t-table to go with the equation of the function.
::首先,创建一个可使用函数方程式的t表。0 60 1 120 2 240 3 480 4 960 5 1920 6 3840 7 7680 8 15360 Next, graph the function.
::下一位, 绘制函数图 。Example 2
::例2Graph the following.
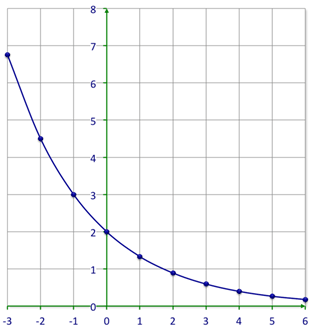
::如下图所示。
::y=2x( 23) xFirst, fill in the table of values.
::首先,填写数值表。Next, graph the function.
::下一位, 绘制函数图 。Example 3
::例3Identify the function .
::识别函数y=4x。is an exponential function.
::y=4x是一个指数函数。Example 4
::例4Identify the function .
::识别函数 y=3x- 1。is a linear function .
::y=3x-1是一个线性函数。Example 5
::例5Identify the function .
::识别函数 y=ax2-bx+c。is a quadratic function .
::y=ax2-bx+c 是一个二次函数。Review
::回顾Classify the following functions as exponential or not exponential. If it is not exponential, state the reason why.
::将以下函数分类为指数值或非指数值。如果它不是指数值,请说明原因。-
::y=7x y=7x -
::2×10d -
::y=1x y=1x -
::y=4x y=4x -
::n=0x( 12) x -
::y=5x( 43)x -
::y=(-7)x -
Use a table of values to graph the function
.
::使用数值表格来图形函数 y=3x 。 -
Use a table of values to graph the function
.
::使用数值表格来图形函数y=( 13) x。 -
What type of graph did you make in number 7?
::7号的图表是哪类的? -
What type of graph did you make in number 8?
::你在8号做哪类图表? -
Use a table of values to graph the function
.
::使用数值表格来图形函数 y2x 。 -
Use a table of values to graph the function
.
::使用数值表格来图形函数 y=5x。 -
Use a table of values to graph the function
.
::使用数值表格来图形函数 y5x 。 -
Use a table of values to graph the function
.
::使用数值表格来图形函数y=6x。
Review (Answers)
::回顾(答复)Click to see the answer key or go to the Table of Contents and click on the Answer Key under the 'Other Versions' option.
::单击可查看答题键, 或转到目录中, 单击“ 其他版本” 选项下的答题键 。 -