指数增长和衰减
章节大纲
-
A condominium complex charges $185 per month for the homeowners’ association fee. The rates can rise every year because of inflation but they promise not to raise the rates more than 10% each year. Keep in mind, though, that if they raise the rate by 10% the first year, the second year is now more expensive. If they raise the maximum again, they are increasing the original $185 plus the first year’s adjustment by 10%. Graph the situation for 10 years.
::公寓综合体每月收费185美元,以支付房主协会费。 利率可以因通货膨胀而逐年上涨,但保证利率不会每年提高10 % 。 但是,记住,如果第一年将利率提高10 % , 第二年现在更昂贵。 如果他们再次提高最高利率,则将原来的185美元加第一年的调整增加10 % 。 分析10年的情况。How much could the homeowners’ fee be in ten years? Use the function where is the fee after years.
::10年内房主的收费能有多少?使用这个功能f=185x1.1t,f是年之后的收费。In this concept, you will learn to distinguish between and .
::在这一概念中,你会学会区分和区分。Exponential Growth and Decay
::指数增长和衰减Sometimes you will need to identify whether a function is an exponential function . If your function can be written in the form , where and are constants, , and , then it must be exponential. In quadratic equations, your functions were always to the 2 nd power. In , the exponent is a variable . Their graphs will have a characteristic curve either upward or downward.
::有时您需要确定函数是否是一个指数函数。 如果您的函数可以以 y=abx 的形式写成, 其中 a和 b 是常数, a0, b>0, 和 b1, 那么它必须是指数。 在二次方程式中, 您的函数总是在第二倍。 在 中, 引号是一个变量。 它们的图表将有一个向上或向下的特性曲线 。Therefore the function is an exponential function, but is not because .
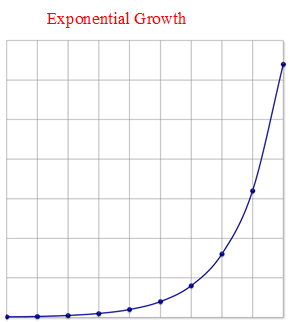
::因此,函数 c=4x10a 是一个指数函数,但 y=6x0x 不是因为 b1 。In some cases with exponential functions, as the value increased, the value increased, too. This was a direct relationship known as exponential growth . As the value increases, the value grows at a very fast rate!
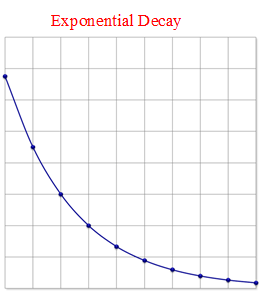
::在某些具有指数函数的情况下, 随着 x 值的增加, y 值也增加了。 这是直接的关系, 被称为指数增长 。 随着 x 值的增加, y 值以非常快的速度增长 !In other cases, as the value increased, the value decreased. This relationship is an inverse relationship known as exponential decay . The graphs of these functions are opposites, reflected on the -axis.
::在其他情况下,随着 x 值的增加, Y 值下降。 此关系是一种反向关系, 被称为指数衰减。 这些函数的图形是相反的, 反映在 Y 轴上 。Examples
::实例Example 1
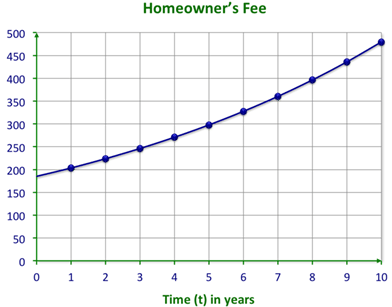
::例1Earlier, you were given a problem about the rising condominium fees. You need to determine how much the homeowners’ fee will be in ten years using the function where is the fee after years.
::早些时候,您曾遇到有关公寓费上涨的问题。 您需要使用 F=185x1.1t 的功能来决定十年内房主费的多少, F 是 T 年之后的f 收费 。First, make a table of values for the function .
::首先,绘制函数 f=185x1.1x 的值表。0 1 2 3 4 5 6 7 8 185 203.50 223.85 246.24 270.86 297.94 327.74 360.51 396.56 Next, graph the function.
::下一位, 绘制函数图 。Example 2
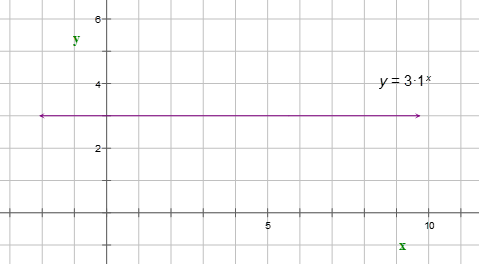
::例2Does the following function represent an exponential function? Graph the function.
::以下函数是否代表指数函数?图形显示函数。
::y=3x1x y=3x1xFirst, answer the question.
::首先,回答问题。No, this function does not represent an exponential function because the value is 1.
::否,此函数不代表指数函数,因为 b 值为 1。Next, graph the function.
::下一位, 绘制函数图 。Example 3
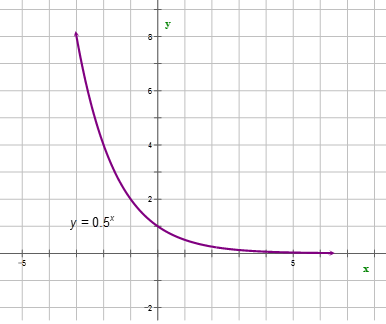
::例3Graph the function and tell whether it will represent exponential growth or decay.
::绘制函数y=( 12) x 的图, 并显示它代表指数增长还是衰变 。First, graph the function.
::首先,绘制函数图。Next, answer the question.
::下一个,回答问题。From the graph, the function represents exponential decay.
::从图形中,函数 y=( 12)x 表示指数衰减。Example 4
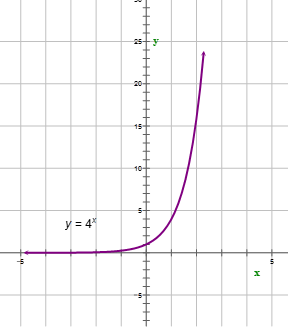
::例4Graph the function and tell whether it represents exponential growth or decay.
::绘制 y= 4x 函数图,并显示该函数代表指数增长还是衰变。First, graph the function.
::首先,绘制函数图。Next, answer the question.
::下一个,回答问题。From the graph, the function represents exponential growth.
::从图中,函数y=4x代表指数增长。Example 5
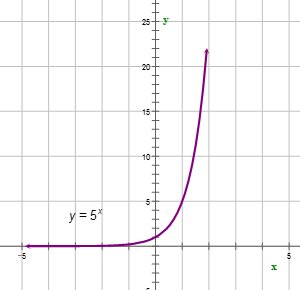
::例5Graph the function and tell whether it represents exponential growth or decay.
::绘制 y= 5x 函数图,并显示该函数代表指数增长还是衰变。First, graph the function.
::首先,绘制函数图。Next, answer the question.
::下一个,回答问题。From the graph, the function represents exponential growth.
::从图中,函数 y=5x 表示指数增长。Review
::回顾Graph each function. Then say whether it represents economic growth or decay.
::每个函数图。 然后说明它是代表经济增长还是代表衰退。-
::y=4x y=4x -
::y=( 12) x -
::y=( 13) x -
::y=7x y=7x -
::y=5x y=5x -
::y=2x y=2x -
::y=( 14) x -
::y=( 34)x -
::y=6x y=6x -
::y=11x y=11x -
::y=9x y=9x -
::y=( 18) x -
::y=12x y=12x -
::y=( 25) x -
::y=13x y=13x
Review (Answers)
::回顾(答复)Click to see the answer key or go to the Table of Contents and click on the Answer Key under the 'Other Versions' option.
::单击可查看答题键, 或转到目录中, 单击“ 其他版本” 选项下的答题键 。 -