普通曲线
章节大纲
-
When students ask their teachers to curve exams, what they often mean is they want everyone to simply get a higher grade. Curving a grade can also mean fitting to a bell curve where lots of people get Cs, some people get Ds and Bs and very few people get As and Fs. Even though this second interpretation is not what most students mean, the normal curve is one of the most widely used and applied probability distributions. What are other examples that follow a normal distribution ?
::当学生要求教师参加曲线考试时,他们通常的意思是,他们希望每个人都获得更高的分数。 缩短一个分数也可以意味着适合一个钟曲线,因为许多人获得C,一些人获得D和B,而很少有人获得A和F。 尽管这第二个解释不是大多数学生所想的,但正常曲线是最广泛使用和应用的概率分布之一。还有什么其他例子可以跟得上正常分布?Normal Distribution
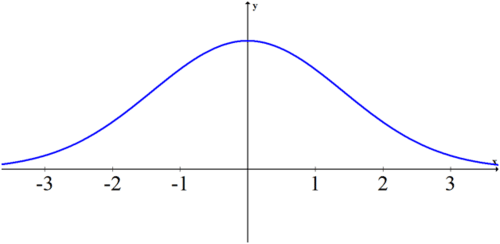
::正常分配The Standard Normal Distribution is graphed from the following function and is represented by the Greek letter phi, ϕ .
::标准正常分配表按以下函数编排,由希腊字母“”表示。ϕ ( x ) = 1 √ 2 π e − 1 2 x 2
:x) = 1 2e - 12x2
This distribution represents a population with a mean of 0 and a standard deviation of 1. The numbers along the x -axis represent standard deviations. For data that is normally distributed, the states that:
::此分布表示平均值为0,标准偏差为1. X轴上的数字代表标准偏差。对于通常分布的数据,规定:-
Approximately 68% of the data will be within 1 standard deviation of the mean.
::大约68%的数据将低于平均值的1个标准差。 -
Approximately 95% of the data will be within 2 standard deviations of the mean.
::大约95%的数据将低于平均值的2个标准差。 -
Approximately 99.7% of the data will be within 3 standard deviations of the mean.
::大约99.7%的数据将低于平均值的3个标准差。
Some other important points about the normal distribution:
::关于正常分配的其他一些要点:-
The total area between the normal curve and the
x
axis is 1 and this area represents all possible probabilities.
::正常曲线与 x 轴之间的总面积为 1, 这个区域代表所有可能的概率 。 -
If data is distributed normally, you can use the normal distribution to determine the percentage of the data between any two values by calculating the
between those two values. When you take calculus, you will learn how to calculate this area analytically, but for now you can use the
normalcdf
function on your calculator.
::如果数据被正常分布,您可以使用正常分布来确定数据在任何两个值之间的百分比,方法是计算这两个值之间的百分比。如果采用微积分,您可以学习如何分析计算这个区域,但现在您可以在计算器上使用普通的 cdf 函数。 -
Many histograms approximate a normal curve, but a true normal curve is infinitely smooth.
::许多直方图接近正常曲线,但真正的正常曲线绝对平滑。
Examples
::实例Example 1
::例1Earlier, you were asked about other examples of normal distribution. Height, weight and other measures of people, animals or plants are normally distributed.
::早些时候,有人问及正常分布的其他例子。 人、 动物或植物的高度、 重量和其他测量标准通常都分布在正常分布中。Example 2
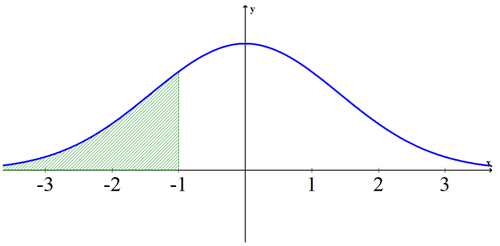
::例2The amount of rain each year in Connecticut follows a normal distribution. What is the probability of getting one standard deviation below the normal amount of rain?
::康涅狄格州每年的降雨量遵循正常分布。 低于正常降雨量的标准偏差有多大?You are looking for the area of the shaded portion of the normal distribution shown below. By the empirical rule, you know that approximately 34% of the data is in between -1 and 0. Also, 50% of the data is above 0. Therefore, approximately 84% of the data is unshaded. Therefore, 100 % − 84 % = 16 % of the data is shaded. The approximate probability is 16%.
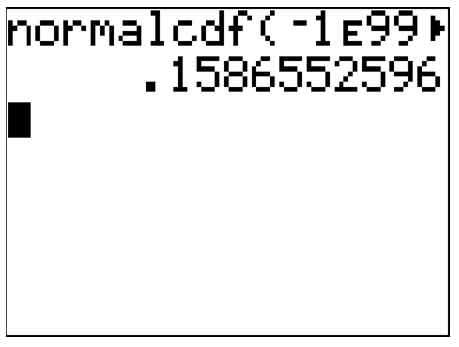
::您正在寻找以下显示的正常分布的阴影部分区域。 根据经验规则, 您知道大约34%的数据在 -1 和 0 之间。 另外, 50%的数据在 0 以上。 因此, 大约84%的数据没有阴影。 因此, 100 84 16%的数据是阴影。 大约概率为 16% 。[ 2 n d ] x -values. The syntax (how you will type it in) for normal cdf is: and calculates the area under the curve between two function distribution cumulative normal [VARS]) and choose normalcdf. This is the To get the exact probability, use the normal cdf function on your calculator to calculate the exact area under the curve. Go to [DISTR] (which is
::[nd] x 值。 普通 cdf 的语法( 如何输入它) 。 普通 cdf 的语法( 如何输入它) 是 : 并计算两个函数分配累积性超常 [VARS] 之间的曲线下的区域, 并选择正态 cdf。 这是要获取准确概率, 使用您计算器上的普通 cdf 函数来计算曲线下的确切区域 。 跳到 [DISTR] (即normalcdf(lower, upper, mean, standard deviation)
::usandcdf( 低、 上、 平均值、 标准差)− ∞ − 1 × 10 99 , an extremely small number, and will give identical results that are correct to many decimal places. The upper bound is -1. For a standard normal distribution with a mean of zero and a standard deviation of 1 you don’t need to type anything else in, but since you will be working with with means and standard deviations that are different, it will make sense to get used to using the whole syntax., but the TI-84 cannot handle that so use -1E99. -1E99 is The lower bound for this shaded region is technically
::\\\\ x1099,这是一个极小的数字, 并且会给出与十进制位数相同的相同结果。 上界值为 -1. 对于一个平均为零的标准正常分布和标准偏差为1, 您不需要输入其它内容, 但是由于您将使用不同的方法和标准偏差, 使用整个语法是有道理的。 但是 TI- 84 无法处理如此使用 - 1/E99 。 - 1E99 是这个阴暗区域的下界是技术上的下界 。normalcdf(-1E99, -1, 0, 1)
::cdf (-1E99, -1, 0, 1)The exact answer is closer to 15.87%.
::准确的答案接近15.87%。Example 3
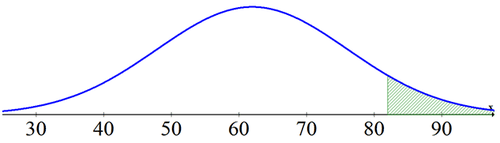
::例3On your first college exam, you score an 82. After the exam the professor tells the class that the mean was a 62 and the standard deviation was 10. What percentage of the class did better than you?
::在你的第一次大学考试中,你得了82分 考试后,教授告诉班级, 平均值是62分, 标准差是10分, 哪个比例的班比你好?An 82 is 20 away from the mean so is 2 standard deviations from the mean. Therefore, this question is asking for the percentage of students that are above +2 standard deviations above the mean.
::82比平均值低20。 2个标准偏差也比平均值低2个。 因此,这个问题要求学生超过+2标准偏差的百分比高于平均值。In future statistics courses you will learn how to create the equation for this distribution and then transform it to standard normal. For now, you can use the fact that your score was exactly 2 standard deviations above the mean. Or, you can calculate the probability using the actual numbers.
::在未来的统计课程中, 您将学习如何为此分布创建方程式, 然后将其转换为标准常态 。 目前, 您可以使用您的分数比平均值差2个标准差这一事实 。 或者, 您可以使用实际数字来计算概率 。-
normalcdf(2, 1E99, 0, 1) = 0.022750 or 2.750%
::=0.0022750或2.750或2.750 -
normalcdf(82, 1E99, 62, 10) = 0.022750 or 2.750%
::=0.0022750或2.750 或2.750
2.75% of the class did better than you on the exam. Even though you seemed to score a B-, the professor would probably note that you were near the top of the class and adjust grades accordingly.
::在考试中,2.75%的班级成绩比你好。尽管你似乎得B分,但教授或许会注意到你接近班级的顶尖,并相应调整成绩。Example 4
::例4What is the probability that a person in Texas is exactly 6 feet tall?
::在得克萨斯州,一个人身高6英尺高的概率是多少?Since height is a continuous variable , meaning any number within a reasonable domain interval is possible, the probability of choosing any single number is zero. Many people may be close to 6 feet tall, but in reality they are 5.9 or 6.0001 feet tall. There must be someone in Texas who is the closest to being exactly 6 feet tall, but even that person when measured accurately enough will still be slightly off from 6 feet. This is why instead of calculating the probability for a single outcome, you calculate the probability between a certain interval, like between 5.9 feet and 6.1 feet. For continuous variables, the probability of any specific outcome, like 6 feet, will always be 0.
::由于高度是一个连续的变量, 这意味着在合理的域间距内任何数字都是可能的, 选择任何单一数字的概率是零。 许多人可能接近6英尺高, 但实际上他们有5. 9或6. 0001英尺高。 得克萨斯州一定有人最接近6英尺高, 但即使准确测量得足够准确, 也从6英尺略差。 这就是为什么你没有计算单一结果的概率, 而是计算某一间隔之间的概率, 如5. 9英尺到6.1英尺。 对于连续变量来说, 任何具体结果的概率, 如6英尺, 总是为0。Example 5
::例5Two percent of high school football players are invited to play at a competitive college level. How many standard deviations above the average player would someone need to be to have this opportunity?
::高中足球运动员中有2%被邀请在竞争性大学水平上参加比赛。 需要多少比普通球员标准差的人才能有这个机会?This situation is the inverse of the previous questions. Instead of being given the standard deviation and asked to find the probability, you are given the probability and asked to find the standard deviation.
::这种情况与前几个问题相反。 没有给标准偏差并被要求寻找概率, 而是给概率并被要求找到标准偏差 。There is a second programmed feature in the distribution menu that performs this calculation. You are looking for how many standard deviations above the mean will include 98% of the data.
::分布菜单中有第二个程序化特性来进行此计算。 您正在寻找超过平均值的多少标准偏差将包含98%的数据 。invNorm(0.98) = 2.0537
:A person would have to be greater than about 2 standard deviations above the mean to be in the top 2 percent.
::一个人必须超过比平均值高出2%的大约2个标准差。Summary -
The
Standard Normal Distribution
is represented by the Greek letter phi and represents a population with a mean of 0 and a standard deviation of 1.
::标准正常分配由希腊字母“phi”表示,代表的人群平均值为0,标准偏差为1。 -
The
empirical rule
states that for normally distributed data, approximately 68% of the data will be within 1 standard deviation of the mean, 95% within 2 standard deviations, and 99.7% within 3 standard deviations.
::经验规则规定,对于通常分发的数据,大约68%的数据将低于平均值的1个标准差,95%在2个标准差范围内,99.7%在3个标准差范围内。 -
The total area between the normal curve and the x-axis is 1, representing all possible probabilities.
::正常曲线和x轴之间的总面积为1,代表所有可能的概率。 -
If data is
normally distributed
, the percentage of data between any two values can be determined by calculating the area under the curve between those values.
::如果数据通常分布,则任何两个数值之间数据的百分比可以通过计算这些数值之间的曲线下的区域来确定。 -
Many histograms approximate a normal curve, but a true normal curve is infinitely smooth.
::许多直方图接近正常曲线,但真正的正常曲线绝对平滑。
Review
::回顾Consider the standard normal distribution for the following questions.
::审议下列问题的标准正常分配情况。1. What is the mean?
::1. 是什么意思?2. What is the standard deviation?
::2. 标准偏差是什么?3. What is the percentage of the data below 1?
::3. 1以下数据的百分比是多少?4. What is the percentage of the data below -1?
::4. 以下数据的百分比是多少?5. What is the percentage of the data above 2?
::5. 以上2项数据的百分比是多少?6. What is the percentage of the data between -2 and 2?
::6. -2和2之间数据的百分比是多少?7. What is the percentage of the data between -0.5 and 1.7?
::7. -0.5和1.7之间数据的百分比是多少?8. What is the probability of a value of 2?
::8. 值为2的概率是多少?Assume that the mean weight of 1 year old girls in the USA is normally distributed, with a mean of about 9.5 kilograms and a standard deviation of approximately 1.1 kilograms.
::假设美国1岁女孩的平均重量通常分布在大约9.5公斤左右,标准偏差约为1.1公斤。9. What percent of 1 year old girls weigh between 8 and 12 kilograms?
::9. 1岁女孩的体重在8至12公斤之间,占多大比例?10. What percent of girls weigh above 12 kilograms?
::10 %的女童体重超过12公斤?11. Girls in the bottom 5% by weight need their weight monitored every 2 months. How many standard deviations below the mean would a girl need to be to have their weight monitored?
::11. 按重量计,体重在5%以下的女孩需要每两个月监测一次体重,比平均数低多少标准偏差需要监测其体重?Suppose that adult women’s heights are normally distributed with a mean of 65 inches and a standard deviation of 2 inches.
::假设成年妇女的高度通常平均为65英寸,标准偏差为2英寸。12. What percent of adult women have heights between 60 inches and 65 inches?
::12. 成年妇女中高在60至65英寸之间的身高是多少?13. Use the empirical rule to describe the range of heights for women within one standard deviation of the mean.
::13. 利用经验规则在平均值的一个标准差内描述妇女的高度范围。14. What is the probability that a randomly selected adult woman is more than 64 inches tall?
::14. 随机挑选的成年妇女身高超过64英寸的概率有多大?15. What percent of adult women are either less than 60 inches or greater than 72 inches tall?
::15. 成年妇女中有多大比例或不到60英寸,或超过72英寸?Review (Answers)
::回顾(答复)Click to see the answer key or go to the Table of Contents and click on the Answer Key under the 'Other Versions' option.
::单击可查看答题键, 或转到目录中, 单击“ 其他版本” 选项下的答题键 。 -
Approximately 68% of the data will be within 1 standard deviation of the mean.