7.17 线性方平方图
章节大纲
-
Dana is collecting information about caterpillars for science class. She’s comparing the lengths and widths of several caterpillars. Dana puts the data she has so far into a table. Dana is convinced there is a pattern . Can organize this information as a set of ordered pairs, graph it on a coordinate plane and write an equation that could model this?
::Dana正在收集科学类毛虫的信息。 她正在比较几只毛虫的长度和宽度。 Dana将她迄今掌握的数据放在一张表格中。 Dana相信有一个模式。 Dana可以将这些信息组织成一组定购配对,在坐标平面上绘制图表,并写出一个可以模拟这个模式的方程式?
In this concept, you will learn to graph on the coordinate plane.
::在此概念中,您将学会在坐标平面上绘制图表。Graphing Linear Functions
::直线函数A linear function is a specific type of function . You may notice that the word “line” is part of the word “linear”. That fact can help you remember that when a linear function is graphed on a coordinate plane, its graph will be a straight line.
::线性函数是一种特定类型的函数。您可能会注意到,“线性”一词是“线性”一词的一部分。这一事实可以帮助您记住,当线性函数在坐标平面上绘制图时,其图将是一个直线线。You can represent a function as a set of ordered pairs, through a table, and as an equation. You can also take the information in ordered pairs or in a table and represent a function as a graph.
::您可以通过表格和方程式代表一组有顺序的对子函数。您也可以以有顺序的对子或表格的形式接收信息,并代表一个图形函数。Let’s look at an example.
::让我们举个例子。The table of values below represents a function on a coordinate plane. On a coordinate plane, graph the linear function that is represented by the ordered pairs in the table below.
::下表所列数值表表示坐标平面上的函数。在坐标平面上,请绘制下表中定购对子所代表的线性函数图。
::Xy-45-23012-14-3You can represent the information in this table as a set of ordered pairs
::您可以以一组有顺序的对{(- 4, 5, 5, (-2, 2, 3, 0, 1), (2, 1), (4, 3)} 来表示此表格中的信息 。Plot those five points on the coordinate plane. Then, connect them as shown below.
::在坐标平面上标出这五个点,然后将它们连接起来,如下文所示。Notice that the graph of this linear function is a straight line.
::注意此线性函数的图形为直线。You can also graph a linear function if you are given an equation for that function. This will involve a few more steps. When you have an equation, you can use the equation to create a table. Then, plot several of the ordered pairs in the table and connect them with a line.
::如果给您给出了该函数的方程式,您也可以绘制线性函数。这将涉及几个步骤。如果您有一个方程式,您可以使用方程式来创建表格。然后,绘制表格中几个有顺序的对,并将它们与直线连接。Here is another example.
::下面是另一个例子。The equation is a linear function. Graph that function on a coordinate plane.
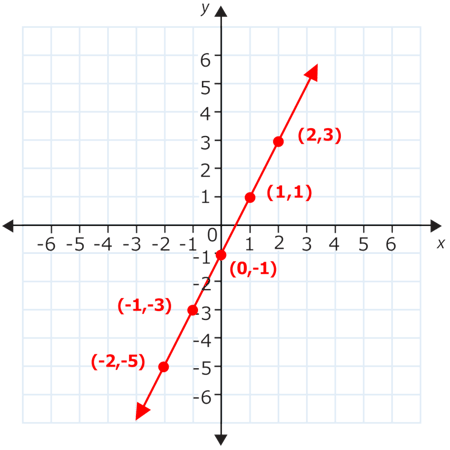
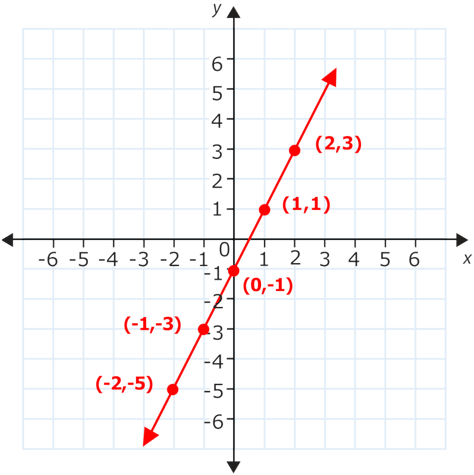
::y=2x- 1 等式是一个线性函数。 图形在坐标平面上起作用 。First, use the equation to create a table and find several ordered pairs for the function. It is a good idea to use some negative -values, some positive -values and 0. For example, you can create a table to find the values of when is equal to -2, -1, 0, 1, and 2.
::首先,使用方程式来为函数创建表格并找到多个有顺序的对。使用一些负 x 值、一些正 x 值和 0,这是一个好主意。例如,您可以创建一个表格,在 x 等于 - 2, - 1, 0, 1, 和 2 时查找 y 值。The ordered pairs shown in the table are and .
::表中显示的有顺序配对是(-2,-5,(-1,-3,(0)-1,(1,1)和(2,3)。Plot those five points on the coordinate plane. Then connect them as shown below.
::在坐标平面上标出这五个点,然后将其连接如下:Examples
::实例Example 1
::例1Earlier, you were given a problem about Dana’s project, which was comparing the lengths and widths of caterpillars.
::更早之前, Dana 的项目给您带来了问题, 比较毛虫的长度和宽度。She’s put the data collected so far in a table (shown below). Can you plot these points and write the equation that models this information?
::她将迄今收集的数据放在一张表格中(如下表所示 ) 。 您能否绘制这些点和写出模拟这些信息的方程式?
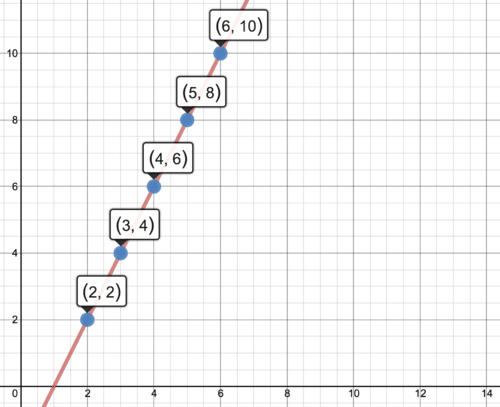
First, represent this information as a set of ordered pairs so that you can plot the points .
::首先,将这些信息作为一组有顺序的对子表示,以便您能够绘制点 {(2),2,(3),(4),(6),(5),(8),(6),(10)}。Now, can you see a pattern in the table and then write the rule that describes it?
::现在,你能在表格中看到一个图案,然后写出描述它的规则吗?Notice that as increases by 1, increases by 2. So, you know that is involved in the equation. But is not quite . It is .
::注意当 x 增加 1 y 增加 2 。 所以, 您知道 2x 包含在方程中 。 但是 y 不是 相当 2x 。 它是 2x-2 。So the equation that models this information is .
::因此,这种信息模型的方程式是 2x-2 。Next, plot the points on the coordinate plane and draw a line through them. The graph is shown below.
::接下来,绘制坐标平面上的点,然后通过它们绘制一条线条。图示如下。Example 2
::例2The table below represents inputs and outputs of a linear function. Can you represent this information as ordered pairs, figure out the equation for this function, and then graph the function?
::下表显示线性函数的输入和输出。您能否以定购对对表示此信息, 找出此函数的方程式, 然后绘制函数图 ?
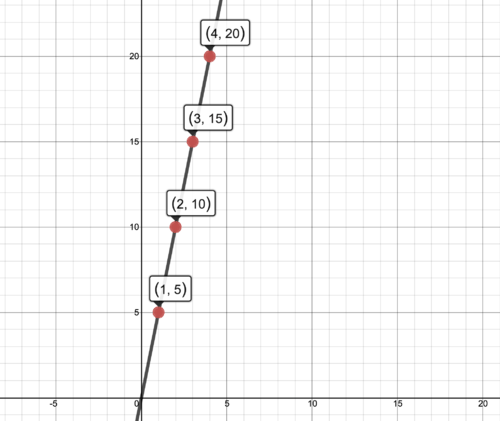
::xy15210315420You can extract information from the table and represent the same information as a set of ordered pairs. The -coordinate is the first value and the -coordinate is the second value.
::您可以从表格中提取信息,并代表与一组定购对对相同的信息。 x 坐标是第一个值, Y 坐标是第二个值。Next, looking at the information in the table, you can see that when you multiply the -value by 5 you get the -value. The rule is multiply by 5 to get . You can write this as an equation.
::接下来,看看表格中的信息,你可以看到,当乘以 X 值乘以 5 时,你就会得到 Y 值。规则是乘以 x 乘以 5 以 y。你可以将此写成一个方程。
::y=5x y=5xYou can graph plot the coordinates and draw a line through them to see the graph.
::您可以绘制坐标 {(1, 5, (2, 10), (3, 15), (4, 20)) 并绘制一条线以查看图表 。Answer the following questions about functions and coordinates.
::回答下列关于职能和坐标的问题。Example 3
::例3Is the function above increasing or decreasing?
::职能高于增加还是减少?Notice that as increases increases. Notice that every time you increase by 1, will always increase. In this case, increases by two every time increases by 1.
::注意 x 增加 y 增加 y 增加 。 注意每次增加 x 1, y 总是增加 。 在这种情况下, y 每次增加 1 增加 2 y 增加 。The answer is the function is increasing.
::答案是功能正在增加。Example 4
::例4In the point is the -value positive or negative?
::在点(-3,4)中,X值是正值还是负值?The -value is the first value in the coordinate. It is a negative number.
::x 值是坐标的第一个值。 这是一个负数 。The answer is the -value is negative.
::答案是x值为负值。Example 5
::例5In , which value is -value?
::在(-6,-7)中,什么值是Y值?The -value is the second value in a coordinate, and it is equal to -7.
::Y值是坐标中的第二个值,等于-7。The answer is the -value is -7.
::答案是Y值是 -7Review
::回顾The information in the table represents points from a linear function. Plot the points in the table on a coordinate plane, and then draw a straight line through them to graph each function. Then identify the rule (equation) for the function.
::表格中的信息代表线性函数的点。在坐标平面上绘制表格中的点,然后通过它们绘制一条直线以图示每个函数。然后为函数指定规则(等距)。Input Output 1 4 2 5 3 6 4 7 Input Output 2 4 3 6 4 8 5 10 Input Output 1 3 2 6 4 12 5 15 Input Output 9 7 7 5 5 3 3 1 Input Output 8 12 9 13 11 15 20 24 Input Output 3 21 4
28 6 42 8 56 Input Output 2 5 3 7 4 9 5 11 Input Output 4 7 5 9 6 11 8 15 Input Output 5 14 6 17 7 20 8 23 Input Output 4 16 5 20 6 24 8 32 Review (Answers)
::回顾(答复)Click to see the answer key or go to the Table of Contents and click on the Answer Key under the 'Other Versions' option.
::单击可查看答题键, 或转到目录中, 单击“ 其他版本” 选项下的答题键 。Resources
::资源