7.18 线性和非线性函数区分
章节大纲
-
The championship bicycling race is a major event. Jess has trained for years to compete at this level and can go quite fast. Starting from rest, Jess can accelerate to 20 miles per hour. The coach records times and speeds and puts them in a table (shown below). The coach wants to measure Jess’s progress and to see if there is a pattern in this data.
::锦标赛赛是一个重大事件。 杰西已经训练了多年在这个水平上竞争,并且可以快速前进。 从休息开始,杰西可以加速到每小时20英里。 教练记录时间和速度,并把它们放在一张桌子上(如下表所示 ) 。 教练想测量杰西的进步,看看这个数据是否有模式。Input (time) Output ( speed in mph) 0 0 1 2 3 5 5 10 8 20 Can you plot this data on a coordinate plane , and then determine if this data could be modeled by a linear function ?
::您能否在坐标平面上绘制此数据,然后确定该数据是否可以用线性函数模拟?In this concept, you will learn to distinguish between linear and nonlinear functions.
::在此概念中,您将学会区分线性函数和非线性函数。Distinguishing Between Linear and Nonlinear Functions
::线性函数和非线性函数的区分If you graph a linear function you will get a straight line. There are also nonlinear functions . If you graph the coordinates of a nonlinear function you will not get a straight line.
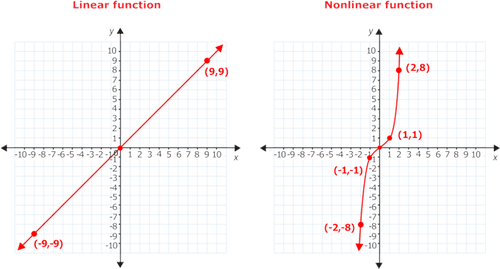
::如果您绘制线性函数, 将会得到一条直线。 还有非线性函数。 如果您绘制非线性函数的坐标, 您将不会获得一条直线。One of the easiest ways (but not the only way) to distinguish between a linear and a nonlinear function is to look at the graph of the function. Look at the two graphs below and you will see the difference between the two types of functions.
::区分线性函数和非线性函数的最简单方法之一(但不是唯一的方法)是查看函数的图形。看看下面的两个图形,你会看到两种函数之间的差异。The first graph above is a linear function because its graph is a straight line. The second graph is a nonlinear function. Notice that the graph of this function is not a straight line. It is curved.
::以上第一个图形是一个线性函数,因为它的图形是一条直线。第二个图形是一个非线性函数。请注意,此函数的图形不是一条直线。它是曲线。So, if you plot points from a function and cannot draw a straight line through them, then it is not a linear function.
::所以,如果您从函数中绘制点,但无法通过它们绘制直线,那么它不是一个线性函数。Let’s look at an example.
::让我们举个例子。The equation is a function.
::y=x2 等式是一个函数 。-
Plot several points to sketch a graph of the function.
::绘制几个点绘制函数图示。 -
Determine if the function linear or nonlinear.
::确定函数线性或非线性。
First, consider part a .
::首先,考虑A部分。Use the equation to create an input-output table . Use five -values so you get a sense of what the function will look like when graphed. Pick positive and negative -values centered around 0.
::使用方程式创建输入输出表 。 使用 5 x 值, 这样您就能了解图形绘制时函数的外观。 选择正值和负值的 X 值, 以 0 左右为中心 。Input Output The ordered pairs shown in the table are and .
::表中显示的定购配对是(-2,4,(-1,1,1,0,0,0,1,1)和(2,4)。Plot those five points on the coordinate plane. Then, draw a curve to connect them.
::在坐标平面上绘制五个点。然后绘制一个曲线来连接它们。The graph of is shown below. This kind of curve is called a parabola .
::y=x2 的图形显示在下面。这种曲线被称为抛物线。Next, consider part b .
::下一步,考虑B部分。Notice that you cannot connect these points with a straight line. You will need to draw a curved line to connect them.
::注意您无法将这些点与直线连接。 您需要绘制一条曲线以连接它们 。The answer is is not a linear function.
::答案是 y=x2 不是线性函数 。Examples
::实例Example 1
::例1Earlier, you were given a problem about the bike race.
::早些时候,有人给了你一个自行车赛的问题Jess’s coach recorded times and speeds in the table below. You need to determine if this data could be modeled by a linear function.
::Jess的教练在下表中记录了时间和速度。 您需要确定是否可以用线性函数模拟这些数据。Input (time) Output (speed in mph) 0 0 1 2 3 5 5 10 8 20 First, write the information in this table as coordinates: .
::首先,在本表格中按坐标填写信息: (0,0,(1,1,2,)(3,5,5,5,10,(8),20)。Then, plot these points (shown below).
::然后,你把这些地方设一个计数点。Next, determine if a linear function could model this data. Can you draw a straight (not curved) line that connects all of these points? You can get close, but a straight line will not go through all of the points, and is likely not the best model for this data.
::下一步, 确定线性函数是否可模拟此数据。 您能否绘制一条连接所有这些点的直线( 不是曲线) 线条? 您可以接近, 但直线不会通过所有点, 并且可能不是此数据的最佳模型 。The answer is no, this data is not part of a linear function.
::答案是否,此数据不是线性函数的一部分。Example 2
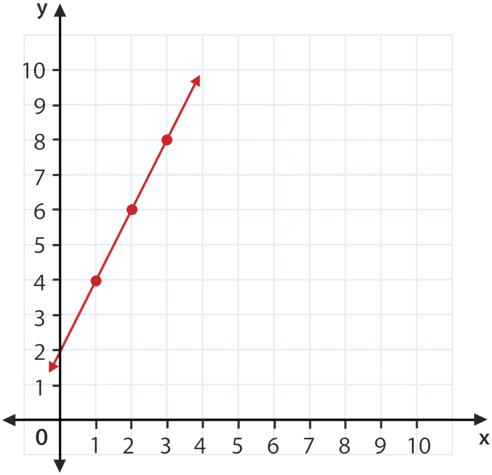
::例2Look at the graph of a function below. Is this a linear or nonlinear function? Explain your answer. Then, write the coordinates of the ordered pairs highlighted on the graph.
::查看下方函数的图形。 这是线性函数还是非线性函数? 请解释您的回答 。 然后, 请写下图表上突出显示的有顺序对的坐标 。The answer is that this is a linear function because the graph is a straight line.
::答案是,这是一个线性函数,因为图形是直线。The ordered pairs graphed are .
::图表显示的订购对数为(0)2,(1,4),(2,6),(3,8)。Several points from a function have been provided in the examples below. Determine if the points could be part of a linear function.
::以下示例提供了函数的若干点。 确定这些点是否属于线性函数的一部分。Example 3
::例3Plot these points on a coordinate plane. Since you can connect them with straight line (using a straight edge), they could be part of a linear function.
::在坐标平面上绘制这些点。 由于您可以用直线( 使用直线边缘) 连接这些点, 它们可能是线性函数的一部分 。The answer is these points could be from a linear function.
::答案是,这些点可以是线性函数的。Example 4
::例4Plot these points on a coordinate plane. Because you cannot connect these lines with a straight line, these points are not part of a linear function.
::在坐标平面上绘制这些点。由于您无法将这些线条与直线连接,这些点不是线性函数的一部分。The answer is these points are from a nonlinear function.
::答案是这些点来自非线性函数。Example 5
::例5Plot these points on a coordinate plane. Since you can connect them with straight line (using a straight edge), they could be part of a linear function.
::在坐标平面上绘制这些点。 由于您可以用直线( 使用直线边缘) 连接这些点, 它们可能是线性函数的一部分 。The answer is these points could be from a linear function.
::答案是,这些点可以是线性函数的。Review
::回顾Determine if each graph shows a linear function or a nonlinear function.
::确定每个图表是显示线性函数还是非线性函数。-
-
-
-
The equation
is a function. Complete the table below to identify five ordered pairs for this function, and then plot the points on a coordinate plane. Then connect those points to sketch a graph for this function.
::y=x2+4 等式是一个函数。完成下面的表格,为此函数确定五个有顺序的对,然后在坐标平面上绘制点。然后将这些点连接到为此函数绘制图表上。
-4 -2 0 2 4 -
Is the function you graphed in the previous question
a linear function or a nonlinear function?
::上一个问题(y=x2+4)中您图形显示的函数是线性函数还是非线性函数? -
The equation
is a function. Complete the table below to identify five ordered pairs for this function. Plot those points on the coordinate plane below. Then connect those points to sketch a graph for this function.
::y=x2+2 等式是一个函数。完成下面的表格以识别此函数的五对顺序。在下面的坐标平面上绘制这些点。然后将这些点连接到为此函数绘制图表上。
-2 -1 0 1 2 -
Is the function you graphed in the previous question
a linear function or a nonlinear function?
::您在上一个问题(y=x2+2)中绘制的函数是线性函数还是非线性函数?
The rule for a linear function is: add 1 to each -value to find each -value.
::线性函数的规则是:为查找每个 Y 值,在每个 x 值中增加 1 。-
Write an equation that represents this linear function.
::写入代表此线性函数的方程式 。 -
Graph the function on this coordinate plane.
::在此坐标平面上绘制函数图 。
The rule for a linear function is: multiply each -value by 2 and then subtract 2 to find each -value.
::线性函数的规则是:将每个 x 值乘以 2,然后减去 2 以查找每个 Y 值。-
Write an equation that represents this linear function.
::写入代表此线性函数的方程式 。 -
Graph the function on this coordinate plane.
::在此坐标平面上绘制函数图 。
Review (Answers)
::回顾(答复)Click to see the answer key or go to the Table of Contents and click on the Answer Key under the 'Other Versions' option.
::单击可查看答题键, 或转到目录中, 单击“ 其他版本” 选项下的答题键 。Resources
::资源 -
Plot several points to sketch a graph of the function.