7.19 线性和非线性变化模式
章节大纲
-
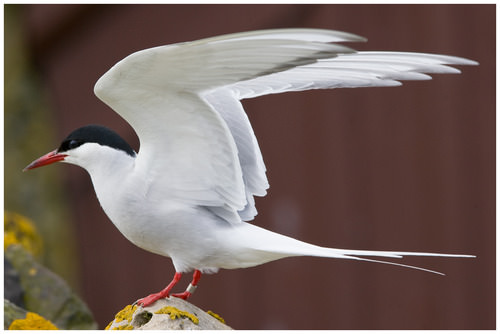
Some ocean birds dive from high above to catch fish swimming near the surface of the ocean. Samuel’s favorite ocean bird is called a tern. After much observation, Samuel figures out that the equation , where is in seconds and is in feet, approximately models the height of a tern on its descent into the ocean to catch a fish.
::一些海鸟从高处下潜到海洋表面附近游泳的鱼群。塞缪尔最喜爱的海鸟被称为“燕子 ” 。 经过多次观察后,塞缪尔发现方程式 h=19-16.1t2, 以秒计,以足为单位,大概可以模拟坠入海洋的海燕的高度,以捕获鱼。Is this function linear or nonlinear? Can you plot points using this equation and sketch a graph of the tern’s descent into the ocean?
::这个函数是线性函数还是非线性函数? 您可以用这个方程式绘制点数, 并绘制一个恒星坠入海洋的图表吗 ?In this concept, you will learn to model and solve real-world problems involving patterns of change and .
::在这一概念中,你们将学会模拟和解决现实世界中涉及变化模式和变化模式的问题。Solving Problems Involving Patterns of Change
::解决涉及变化模式的问题Functions can be used to model real-world data. Sometimes this data is linear, and can be modeled by a linear function , and sometimes the data is nonlinear, and thus cannot be modeled by a linear function.
::函数可用于模拟真实世界数据。 有时,这些数据是线性数据, 可以用线性函数模拟, 有时数据是非线性数据, 因此不能用线性函数模拟。Let’s look at an example.
::让我们举个例子。The table below shows how the total cost of buying tomatoes at the farmer’s market changes depending on the number of pounds of tomatoes purchased.
::下表显示在农民市场购买西红柿的总成本变化情况,取决于购买西红柿的磅数。Number of Pounds Purchased Total Cost in Dollars 1 2 2 4 3 6 4 ? 5 ? -
Assuming the
pattern
presented continues write an equation which models the relationship between the number of pounds purchased and the total cost.
::假设提出的模式继续写出一个方程式,该方程将计算购买的磅数与总成本之间的关系。 -
Create a graph to represent the relationship between the number of pounds of tomatoes purchased,
, and the total cost,
.
::创建图表以显示购买的西红柿磅数、 x 和总成本 y 之间的关联。 -
Determine the cost of buying 5 pounds of tomatoes at the farmer’s market.
::确定在农民市场上购买5磅西红柿的成本。
Consider part a first.
::考虑第一部分。You can see that as increases by 1, increases by 2. You may also notice that is twice as much as .
::您可以看到 x 增加 1, y 增加 2 。 您也可以注意到 y 是 x 的两倍 。Since you assume that this pattern continues, the rule for this function is: multiply each -value by 2 to find its corresponding - value.
::由于您假设这个模式会继续下去, 此函数的规则是: 将每个 x 值乘以 2 以找到相应的 y 值 。Now, translate those words to an equation. The equation is .
::现在,把这些单词转换成方程式。 方程式是 Y= 2x 。Next, consider part b .
::下一步,考虑B部分。You need to make a graph that represents the function .
::您需要绘制一个代表 y=2x 函数的图形 。First, plot the coordinates and from the table. Then, draw a line through the points.
::首先,从表格中绘制坐标(1,2,(2),(4)和(3,6),然后通过点绘制一条线。The graph above represents the relationship between the number of pounds of tomatoes purchased, , and the total cost, .
::上图显示了所购买的西红柿磅数x与总成本y之间的关系。Finally, consider part c .
::最后,审议C部分。There are two ways to approach finding what is, when .
::当 x=5 时,有两种方法可以找到 y 是什么。One way, is to use the equation which models this data. Then, you just plug in 5 for .
::一种方法,是使用 y=2x 的方程式来模拟这些数据。然后,您只需插入 5 的 x 。
::y=2xy=2(5)y=10The answer is the total cost of 5 pounds of tomatoes is 10 dollars.
::答案是5磅西红柿的总成本是10美元。The other way to solve part c , is to complete the pattern (which you are assuming continues) in the table. The pattern is that if increases by 1, increases by 2.
::解决C部分的另一种方式是完成表格中的图案(您假设将继续这样做)。图案是,如果x增加1,y增加2,则x增加1,y增加2。The completed table is shown below.
::填写的表格如下。Number of Pounds Purchased
::购买(十)英镑Total Cost in Dollars "> 1 2 2 4 3 6 4 8 5 10 Looking at the table, you can see that the answer is the total cost of 5 pounds of tomatoes is 10 dollars.
::看这张表,你可以看到答案是 5磅西红柿的总成本是10美元。Examples
::实例Example 1
::例1Earlier, you were given a problem about Samuel’s tern.
::更早之前,The tern dives into the ocean to catch fish. On one such decent, the bird starts from 19 feet in the air and dives down to the surface of the ocean. Its descent can be modeled by the equation below.
::这只鸟从19英尺的空中开始潜到海洋表面, 其下沉可以以下面的方程式为模型。
::h=19-16.1t2In this equation, is in seconds and is in feet.
::在这个方程式中, t 以秒计, h 以足计。Can you make a table from this equation?
::你能用这个方程式做一张桌子吗?First, start when and then go by small increments of time. Use increments of .2 and then round answers to the nearest tenth. This descent happens quickly.
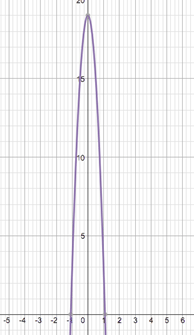
::首先,从 t=0 开始, 然后用小时间递增。 使用 2 的递增, 然后对最近的 10 个回答回合。 这种下降会很快发生 。Height from ocean in feet Time in seconds 0 19 .2 18.4 .4 16.4 .6 13.2 .8 8.7 1 2.9 Next, can you graph this data and connect the points?
::下一步, 您可以绘制此数据并连接点吗 ?The graph below represents this data.
::下图显示了这一数据。For this situation, it makes sense to only look at values when and .
::对于这种情况,只有在 t>0 和 h>0 时查看数值才有意义。Finally, determine if this graph is linear or nonlinear.
::最后,确定该图是线性还是非线性。Since, a straight line does not go through the points from the table, the graph is nonlinear. You may also notice that for a constant change in of .2, does not have a constant rate of change .
::由于直线不穿透表格的点, 图表是非线性图。 您也可以注意到, 如果 2 的 x 不变变化, y 没有固定的变动率 。Example 2
::例2Is the following true or false?
::以下是真实的还是虚假的?If a function is linear, then, for each constant increase in , there is a constant increase in . That is, every time increases by a constant number, will increase by a constant number.
::如果函数为线性,那么,对于x的每个常数增长,y的常数增长。也就是说,每x增加一个常数,y就会增加一个常数。True. Plot points where, every time increases by a constant number, increases by a constant number. For example, try plotting points where every time increases by 3, increases by 5. You can connect these points with a straight line, so it is a linear function.
::正确。 绘制点, 每当 x 增加一个不变数, y 增加一个不变数, y 增加一个不变数。 例如, 尝试绘制点, 每一次 x 增加 3 、 y 增加 5 。 您可以将这些点与一条直线连接, 所以它是一个线性函数 。Solve for using the given , using the equation .
::使用给定 x , 使用 y=2x 等式解决 y 。Example 3
::例3When
::x=4 当 x=4
::y=2xy=2(4)y=8The answer is .
::答案是y=8Example 4
::例4When
::当 x=4.5 时
::y=2xy=2(4.5)y=9The answer is .
::答案是y=9Example 5
::例5When
::当 x= 5. 5
::y=2xy=2( 5.5)y=11The answer is .
::答案是y=11。Review
::回顾Look at the information in each table and determine whether the data could be from a linear function or not.
::查看每个表格中的信息,并确定数据是否来自线性函数。0 2 1 3 2 5 4 4 1 3 2 5 3 7 4 9 2 6 3 9 5 15 6 18 2 3 3 4 6 7 8 9 8 4 6 12 2 8 0 0 0 3 1 4 2 5 6 9 5 11 4 9 3 7 2 5 1 7 3 4 2 9 5 8 1 3 2 6 4 12 6 18 4 2 5 3 6 5 7 1 The table below shows how the total cost of buying gasoline at Gary’s Gas Station changes depending on the number of gallons purchased.
::下表显示加里加油站购买汽油的总费用根据购买加仑数量的变化情况。Number of Gallons Purchased Total Cost in Dollars "> 0 0 1 3 2 6 3 ? -
Assuming the pattern continues in the table above, write an equation to describe the relationship between
and
.
::假设图案在上表中继续,写一个方程来描述x和y之间的关系。 -
Create a graph to represent the relationship between the number of gallons purchased,
, and the total cost,
. Use the blank axes below to create your graph.
::创建图形以显示购买的加仑数、 x 和总成本之间的关系, y。 使用下面的空白轴来创建您的图形 。
-
Assuming the pattern continues, determine the cost of buying 3 gallons of gasoline at Gary’s Gas Station.
::假设这种模式继续下去,确定在加里加油站购买3加仑汽油的费用。
Franklin has a $10 bus card. Each time he rides the bus, $2 is deducted from his card. The equation represents the relationship between , the number of bus rides Franklin takes and , the number of dollars that are left on his card.
::富兰克林有一张10美元的公交卡。每次他乘坐公交卡,从卡片上扣除2美元。等式y=10-2x代表x之间的关系,乘公交卡的次数,富兰克林拿的公交卡数,Y,卡片上留下的美元数。-
Create a table to show how many dollars will be left on Franklin’s bus card after he has used it for a total of 0, 1, 2, and 3 bus rides.
::建立一张表格, 显示富兰克林在用完车程共计0、1、2和3次后, 公交卡上会留下多少美元。 -
Create a graph that represents the relationship between the total number of bus rides Franklin takes,
, and the number of dollars left on the card,
. Use the blank axes below to create your graph.
::创建一个图形, 以显示富兰克林乘坐的公交车总次数、 x 和卡片上剩下的美元数之间的关系, y。 使用下面的空白轴来创建您的图表 。
-
If Franklin takes a total of 4 bus rides, how many dollars will be left on his bus card?
::如果富兰克林坐4辆公交车, 他的公交卡上还剩多少美元?
Review (Answers)
::回顾(答复)Click to see the answer key or go to the Table of Contents and click on the Answer Key under the 'Other Versions' option.
::单击可查看答题键, 或转到目录中, 单击“ 其他版本” 选项下的答题键 。 -
Assuming the
pattern
presented continues write an equation which models the relationship between the number of pounds purchased and the total cost.