11.10 口述盒和口述口语笔
章节大纲
-
Mr. Hernandez gave his students a science quiz. He has organized the quiz scores in the table below.
::Hernandez先生为学生举办了科学测验,在下表中安排了测验分数。Science Quiz Results Student Test Score AS 89 AS 91 BC 87 CS 77 FR 72 JW 59 ML 76 MY 68 SR 83 ST 91 VS 81 ZS 73 Mr. Hernandez wants to create a graph to display the distribution of the scores. How can he do this?
::Hernandez先生想建立一个图表来显示得分的分布。他怎么能这样做呢?In this concept, you will learn how to create and read box-and-whisker plots.
::在这个概念中,你将学会如何创造和读取纸箱和纸箱的地块。Creating and Reading Box-and-Whisker Plots
::创建和阅读插箱和口述口语笔画Data is a set of numerical or non-numerical information. Data can be analyzed in many different ways. In this concept you will analyze numerical data using box-and-whisker plots.
::数据是一组数字信息或非数字信息。数据可以多种不同方式分析。在这个概念中,您将使用框和键图分析数字数据。is a numerical value that represents the middle term in a data set . When ordered sequentially, the value that is in the middle of the data set is the median.
::是一组数据集中代表中期的数值。按顺序排列时,数据集中间的数值是中位数。The range of a set of data is the difference between the largest and smallest values. The range identifies how far apart the values are in the data set.
::一组数据的范围是最大值和最小值之间的差别。该范围确定数据集中值的距离。The minimum is the smallest value in the data set.
::最小值是数据集中最小值。The maximum is the largest value in the data set.
::最大值是数据集中的最大值。Quartiles divide data sets into four equal groups. The first quartile is the median of the lower half of the data set. The second quartile is the median of the data set. The third quartile is the median of the upper half of the data set.
::四分制将数据集分为四个等分组。第一个四分位数是数据集下半部的中位数。第二个四分位数是数据集的中位数。第三个四分位数是数据集上半部的中位数。One way to display data is in a box-and-whisker plot . A box plot illustrates the distribution of the data set in quartiles. A box is made around the median, with the sides of the box being the first and third quartiles. The whiskers are the lines extending outwards from either side of the box indicating the range of the data set. Box and whisker plots can be oriented vertically or horizontally.
::显示数据的一种方式是用盒子和小费图案显示数据。框图案以四角形显示数据集的分布。框图案围绕中位数制作一个框,框的侧面是第一个和第三个四角形。胡须是显示数据集范围的从框体两侧向外延伸的线条。框和胡须图案可以垂直或水平方向。Let's look at an example.
::让我们举个例子。Create a box-and-whisker plot to display the data below.
::创建一个框和小费图以显示下面的数据 。45, 58, 34, 42, 52, 49, 50, 45, 51
First, arrange the data in order from smallest to largest.
::首先,按从最小到最大的顺序排列数据。34, 42, 45, 45, 49, 50, 51, 52, 58
Next, find the median, which is the middle number. There are nine terms, so the fifth term is the median, 49. The median will not be used in calculating the first or third quartiles.
::接下来, 找到中位数, 即中间数。 有九个词, 所以第五学期是中位数, 49。 中位数将不会用于计算第一或第三四分位数 。Next, find the first quartile, which is the middle number of the lower half of the data set. Since 49 is not included, there are four terms in the lower half of the set. The median of this set is between the second and third terms, 42 and 45. To find the median we add the two terms together and divide by 2.
::接下来,请找到第一个四分位数,这是数据集下半部分的中间数字。 由于49个词没有包含在内, 下半部分有四个条件。 这个集的中位数介于第二和第三个条件之间, 42 和 45 之间。 要找到中位数, 我们将这两个条件加在一起, 并除以 2 。So, the first quartile is 43.5. This will be the left side of the box.
::第一个四分位数是43.5。 这是盒子的左侧。Next, find the third quartile, which is the middle number of the upper half of the data set. Since 49 is not included, there are four terms in the upper half of the set. The median of this set is between the second and third terms, 51 and 52. To find the median we add the two terms together and divide by 2.
::接下来,请找到第三个四分位数,这是数据集上半部的中间数字。 由于49个词没有包含在内, 上半部有4个条件。 该组的中位数介于第二和第三个条件之间, 51和52。 要找到中位数, 我们将两个条件加在一起, 并除以2, 中位数介于第二和第三个条件之间 。So, the third quartile is 51.5. This will be the right side of the box.
::所以,第三个四分位数是51.5。 这是盒子的右侧。Next, find the minimum and maximum of the data set. These will be the ends of the whiskers. The minimum is the smallest term in the set. In this case, it's 34. The maximum is the largest term in the set. In this case, it's 58.
::接下来,找到数据集的最小值和最大值。 这些将是胡须的终点。 最小值是集中的最小值。 在此情况下, 最大值是集中的最大值。 在这种情况下, 最大值是58 。Next, draw the box-and-whisker plot. Begin by drawing a number line that begins below the minimum, 34, and extends beyond the maximum, 58. In this case the number line should be drawn from 30 to 60. Then draw the box and whisker plot above the number line.
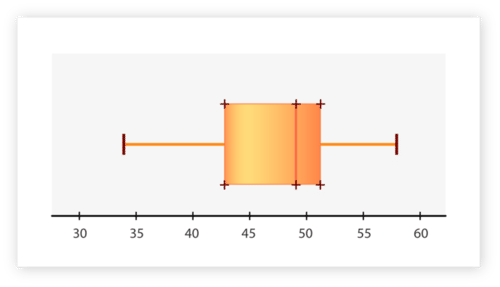
::下一步, 绘制盒子和小费的图案。 开始绘制一个开始于最小值以下的数条, 开始于34, 并超越最大值, 58. 在此情况下, 数字线应该从 30 绘制到 60 。 然后在数字线上划出框和小费的图案 。The box-and-whisker plot should look like the one below.
::盒子和口哨的图案应该像下面的图案。Examples
::实例Example 1
::例1Earlier, you were given a problem about Mr. Hernandez and his science quiz.
::早些时候,你得到一个问题 赫南德斯先生和他的科学测验。Mr. Hernandez gave his class a science quiz and wants to create a graph to show the distribution of the scores. He organized his data into the table below.
::Hernandez先生为他的班级做了一次科学测验,并想建立一个图表,显示得分的分布情况,他将数据整理成下表。Science Quiz Results Student Test Score AS 89 AS 91 BC 87 CS 77 FR 72 JW 59 ML 76 MY 68 SR 83 ST 91 VS 81 ZS 73 How can you represent this data in a graph?
::您如何在图表中显示此数据 ?First, decide what kind of graph to make. Since you want to show the distribution of the quiz scores, a box-and-whisker plot is best.
::首先, 决定要绘制什么样的图表 。 既然你想显示测验分数的分布, 最好先用纸盒和口哨图来显示 。Next, organize the data from smallest to largest.
::下一步,组织从最小到最大的数据。Science Quiz Results (smallest to largest) Student Test Score JW 59 MY 68 FR 72 ZS 73 ML 76 CS 77 VS 81 SR 83 BC 87 AS 89 AS 91 ST 91
Next, find the median, which is the middle number. There are twelve terms, so the median is between the sixth and seventh terms, 77 and 81. To find the median, add the two values together and divide by 2.
::找到中位数。 中位数是中位数。 有十二个条件, 所以中位数在第六和第七学期之间, 77和81。 要找到中位数, 将两个数值加在一起, 并除以 2 。The median is 79.
::中位数为79。Next, find the first quartile, which is the middle number of the lower half of the data set. There are six terms in the lower half of the set, 59, 58, 72, 73, 76, and 77. The median of this set is between the third and fourth terms, 72 and 73. The number that is halfway between 72 and 73 is 72.5. The first quartile is 72.5, which will be the left side of the box.
::接下来,请找到第一个四分位数,这是数据集下半部分的中间数。下半部分有六个条件,即59、58、72、73、76和77。 这套的中位数介于第三和第四、72和73之间。 72和73之间的中位数为72.5。 第一个四分位数是72.5,将是盒子的左侧。Next, find the third quartile, which is the middle number of the upper half of the data set. There are six terms in the upper half of the set, 81, 83, 87, 89, 91, and 91. The median of this set is between the third and fourth terms, 87 and 89. The number that is halfway between 87 and 89 is 88. The third quartile is 88, which will be the right side of the box.
::接下来,请找到第三个四分位数,这是数据集上半部的中间数字。在数据集的上半部分有六个条件,即81、83、87、89、91和91。这一组的中位数介于第三和第四、87和89之间。数字介于87和89之间,是88。第三个四分位数为88,将是盒子的右侧。Next, find the minimum and maximum of the data set. These will be the ends of the whiskers. The minimum is the smallest term in the set. In this case, it's 59. The maximum is the largest term in the set. In this case, it's 91.
::接下来,找到数据集的最小值和最大值。 这将是胡须的终点。 最小值是集中的最小值。 在此情况下, 最大值是集中的最大值。 在此情况下, 最大值是91 。Next, draw the box-and-whisker plot. Begin by drawing a number line that begins below the minimum, 59, and extends beyond the maximum, 91. In this case, the number line should begin at 55 and go to 95. Then draw the box-and-whisker plot above the number line.
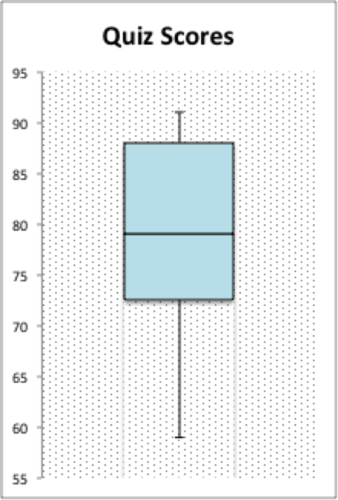
::下一步, 绘制盒子和密码图。 开始绘制一个开始于最小值以下的数值线, 开始于59, 并超越最大值, 91 。 在这种情况下, 数字线应该从55 开始, 转到 95 。 然后将盒子和密码图画在数字线上方 。Lastly, title the graph. The title should be short and clear. In this case, title the graph "Quiz Scores."
::最后,图表的标题。标题应该简短清晰。在这个例子中,标题是“Quiz 评分 ” 。The box-and-whisker plot should look like the one below.
::盒子和口哨的图案应该像下面的图案。Example 2
::例2The data values in the table below illustrate the number of TVs sold at a department store each month for nine months. Create a box-and-whisker plot to display the data.
::下表中的数据值显示每月在百货商店售出九个月的电视机数量。创建显示数据的纸箱和口哨图。April May June July August September October November December 110 98 91 102 89 95 108 118 152 First, arrange the data in order from smallest to largest.
::首先,按从最小到最大的顺序排列数据。89, 91, 95, 98, 102, 108, 110, 118, 152
Next, find the median, which is the middle number. There are nine terms, so the fifth term is the median, 102. The median will not be used in calculating the first or third quartiles.
::接下来,找到中间数字的中位数。有9个学期,所以第五学期是中位数,102。中位数不会用于计算第一个或第三个四分位数。Next, find the first quartile, which is the middle number of the lower half of the data set. Since 102 is not included, there are four terms in the lower half of the set, 89, 91, 95, and 98. The median of this set is between the second and third terms, 91 and 95. To find the median we add the two terms together and divide by 2.
::其次,找到第一个四分位数,这是数据集下半部分的中间数字。由于102项未包括在内,下半部分有4个条件,即89、91、95和98个条件,这一组的中位数介于第二和第三个条件之间,91和95。要找到中位数,我们将两个条件加在一起,再除以2。So, the first quartile is 93. This will be the left side of the box.
::第一个四分位数是93 这是盒子的左侧Next, find the third quartile, which is the middle number of the upper half of the data set. Since 102 is not included, there are four terms in the upper half of the set, 108, 110, 118, and 152. The median of this set is between the second and third terms, 110 and 118. To find the median we add the two terms together and divide by 2.
::其次,请找到第三个四分位数,即数据集上半部的中间数字。由于102项未包括在内,该数据集的上半部分有四个条件,即108、110、118和152。该数据集的中位数介于第二和第三个条件之间,即110和118。要找到中位数,我们将两个条件加在一起,再除以2。So, the third quartile is 114. This will be the right side of the box.
::所以,第三个四分位数是114, 这是盒子的右侧。Next, find the minimum and maximum of the data set. These will be the ends of the whiskers. The minimum is the smallest term in the set. In this case, it's 89. The maximum is the largest term in the set. In this case, it's 152.
::接下来,找到数据集的最小值和最大值。 这些将是胡须的终点。 最小值是集中的最小值。 在此情况下, 最大值是集合中的最大值。 在这种情况下, 最大值是 152 。Next, draw the box-and-whisker plot. Begin by drawing a number line that begins below the minimum, 89, and extends beyond the maximum, 152. In this case, the number line should begin at 80 and go to 160. Then draw the box-and-whisker plot above the number line.
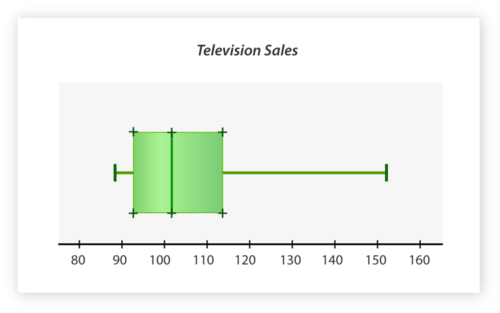
::下一步, 绘制框和键的图。 开始绘制一个开始于最小值以下的数值线, 89, 并扩展至最大值以上, 152。 在这种情况下, 数字线应该从 80 开始, 跳到 160 。 然后在数字线上绘制框和键的图 。Lastly, title the graph. The title should be short and clear. In this case, title the graph "Television Sales."
::最后,标题是图表。标题应该简短清晰。在这个例子中,标题是“电视销售”。The box-and-whisker plot should look like the one below.
::盒子和口哨的图案应该像下面的图案。Example 3
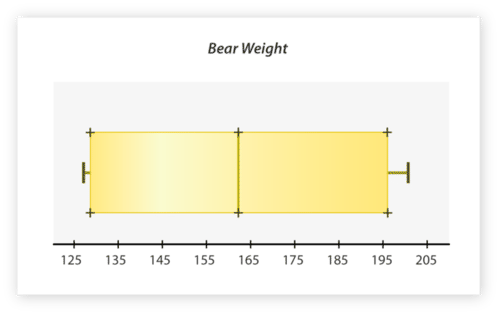
::例3The box plot below shows the weight (in pounds) of black bears. Identify the minimum, maximum, median, first quartile, and third quartile of the data set.
::下面的框图显示黑熊的重量(磅)。标明数据集的最小值、最大值、中位数、第一个四分位数和第三个四分位数。First, find the minimum value of the data set. To do this look at the end of the left whisker. The left whisker ends at 127, so this is the minimum.
::首先, 找到数据集的最小值。 要在左边的发声器末端进行此项查看, 左侧发声器末端为 127, 所以这是最小值 。Next, find the maximum value of the data set. To do this look at the end of the right whisker. The right whisker ends at 201, so this is the maximum.
::下一步, 找到数据集的最大值 。 要这样做, 请看右须须的末端 。 右须的须以 201 结尾, 所以这是最大值 。Next, find the first quartile. To do this look at the left side of the box. The left side of the box is at 129, so this is the first quartile.
::下一步, 找到第一个四分位数 。 要在盒子的左侧看这个。 盒子的左侧是 129, 所以这是第一个四分位数 。Next, find the median. To do this look at the vertical line inside the box. This is at 163, so this is the median.
::下一步, 找到中位数。 要这样看框中的垂直线。 这是 163, 这是中位数 。Next, find the third quartile. To do this look at the right side of the box. The right side of the box is at 196, so this is the third quartile.
::下一步, 找到第三个四分位数 。 要这样看盒子的右侧。 盒子的右侧是 196, 所以这是第三个四分位数 。The answer is the minimum is 127 pounds, the maximum is 201 pounds, the median is 163 pounds, the first quartile is 129 pounds, and the third quartile is 196 pounds.
::答案是最低为127磅,最高为201磅,中位数为163磅,第一个四分位数为129磅,第三个四分位数为196磅。Example 4
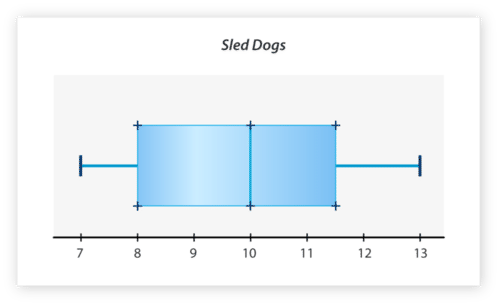
::例4The values in the data set below represent the number of dogs that returned from a sled race. Create a box-and-whisker plot of the data.
::下面的数据集中的值表示从雪橇赛跑返回的狗数。 创建一盒一字不差的数据图 。11, 11, 12, 10, 9, 10, 13, 7, 9, 7
First, order the data from least to greatest.
::首先,将数据从最小到最大排序。7, 7, 9, 9, 10, 10, 11, 11, 12, 13
Next, find the median, which is the middle number. There are ten terms, so the median is between the fifth and sixth terms, 10 and 10. Since these terms are the same, the median is 10. The median will not be used in calculating the first or third quartiles.
::其次,找到中位数,即中位数。有10个条件,因此中位数介于第五和第六学期之间,10和10。由于这两个条件相同,中位数介于10。中位数将不用于计算第一或第三四分位数。Next, find the first quartile, which is the middle number of the lower half of the data set. Since 10 is not included, there are four terms in the lower half of the set, 7, 7, 9, and 9. The median of this set is between the second and third terms, 7 and 9. To find the median we add the two terms together and divide by 2.
::其次,找到第一个四分位数,这是数据集下半部分的中位数。由于10项未包括在内,下半部分有4个条件,即7、7、9和9,该组的中位数介于第二和第三、7和9之间。要找到中位数,我们将两个条件加在一起,再除以2。So, the first quartile is 8. This will be the left side of the box.
::所以,第一个四分位数是8, 这是盒子的左侧。Next, find the third quartile, which is the middle number of the upper half of the data set. Since 10 is not included, there are four terms in the upper half of the set, 11, 11, 12, and 13. The median of this set is between the second and third terms, 11 and 12. To find the median we add the two terms together and divide by 2.
::其次,请找到第三个四分位数,即数据集上半部的中间数字。由于10个词没有包括在内,因此在数据集上半部有4个条件,即11、11、12和13个条件,这一组的中位数介于第二和第三、11和12之间。要找到中位数,我们将两个条件加在一起,再除以2。So, the third quartile is 11.5. This will be the right side of the box.
::所以,第三个四分位数是11.5。 这是盒子的右侧。Next, find the minimum and maximum of the data set. These will be the ends of the whiskers. The minimum is the smallest term in the set. In this case, it's 7. The maximum is the largest term in the set. In this case, it's 13.
::接下来,找到数据集的最小值和最大值。 这将是胡须的终点。 最小值是集中的最小值。 在此情况下, 最大值是集中的最大值。 在此情况下, 最大值是13 。Next, draw the box-and-whisker plot. Begin by drawing a number line that begins at the minimum, 7, and extends to the maximum, 13. In this case, the number line can begin at 7 and go to 13. Then draw the box-and-whisker plot above the number line.
::下一步, 绘制框和键的图。 开始绘制开始于最小数线的数条, 开始于 7 , 延伸至最大数线, 13 。 在这种情况下, 数字线可以从 7 开始, 转到 13 。 然后在数字线上绘制 框和键的图 。Lastly, title the graph. The title should be short and clear. In this case, title the graph "Sled Dogs."
::最后,图表的标题。标题应该简短清晰。在这个例子中,标题是“雪狗”。The box-and-whisker plot should look like the one below.
::盒子和口哨的图案应该像下面的图案。Example 5
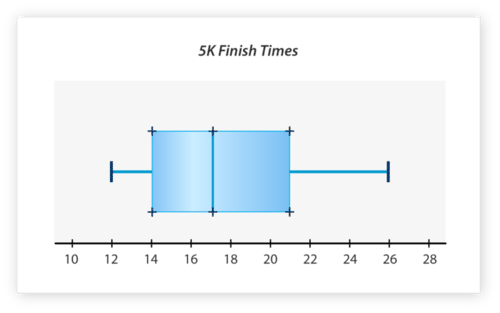
::例5The box-and-whisker plot below was shows 5-K race times for some runners. Identify the minimum, maximum, median, first quartile, and third quartile of the data set.
::下面的盒子和口哨图显示一些选手的5-K赛跑时间。 确定数据集的最低、 最大、 中位、 第一四分位数和第三四位数 。First, find the minimum value of the data set. To do this look at the end of the left whisker. The left whisker ends at 12, so this is the minimum.
::首先, 找到数据集的最小值 。 要在左边的发声器末端进行此项查看 。 左边的发声器末端为 12 , 所以这是最小值 。Next, find the maximum value of the data set. To do this look at the end of the right whisker. The right whisker ends at 26, so this is the maximum.
::下一步, 找到数据集的最大值 。 要这样做, 请看右须须的末端 。 右须的须以 26 结尾 , 所以这是最大值 。Next, find the first quartile. To do this look at the left side of the box. The left side of the box is at 14, so this is the first quartile.
::下一步, 找到第一个四分位数 。 要在盒子的左侧看这个。 盒子的左侧是 14 。 所以这是第一个四分位数 。Next, find the median. To do this look at the vertical line inside the box. This is at 17, so this is the median.
::下一步, 找到中位数。 要这样看框中的垂直线。 这是 17, 这是中位数 。Next, find the third quartile. To do this look at the right side of the box. The right side of the box is at 21, so this is the third quartile.
::接下来, 找到第三个四分位数 。 要在盒子的右侧看这个。 盒子的右侧是 21, 所以这是第三个四分位数 。The answer is the minimum is 12 minutes, the maximum is 26 minutes, the median is 17 minutes, the first quartile is 14 minutes, and the third quartile is 21 minutes.
::答案是最低为12分钟,最高为26分钟,中位数为17分钟,第一个四分位数为14分钟,第三个四分位数为21分钟。Review
::回顾Use each set of data to work with box-and-whisker plots.
::使用每套数据来使用纸箱和耳机图。12, 13, 15, 17, 21, 22, 24, 26, 28, 30, 31
-
What is the median of the set of data?
::数据集的中位数是多少? -
What is the median of the lower quartile?
::下四分位的中位数是多少? -
What is the median of the upper quartile?
::上四分位的中位数是多少? -
What is the lowest value whisker?
::最低价值的怪人是什么? -
What is the highest value whisker?
::什么是最高值的发呆者? -
Use the data to create a box-and-whisker plot.
::使用该数据创建一个纸箱和口哨图 。
26, 27, 29, 30, 32, 35, 41, 42, 44
-
What is the median of the set of data?
::数据集的中位数是多少? -
What is the median of the lower quartile?
::下四分位的中位数是多少? -
What is the median of the upper quartile?
::上四分位的中位数是多少? -
What is the lowest value whisker?
::最低价值的怪人是什么? -
What is the highest value whisker?
::什么是最高值的发呆者? -
Use the data to create a box-and-whisker plot.
::使用该数据创建一个纸箱和口哨图 。
100, 105, 107, 109, 110, 120
-
What is the median of the data?
::数据的中位数是多少? -
What is the median of the lower quartile?
::下四分位的中位数是多少? -
What is the median of the upper quartile?
::上四分位的中位数是多少? -
What is the lowest value whisker?
::最低价值的怪人是什么? -
What is the highest value whisker?
::什么是最高值的发呆者? -
Use the data to create a box-and-whisker plot.
::使用该数据创建一个纸箱和口哨图 。
::使用该数据创建一个纸箱和口哨图 。
Review (Answers)
::回顾(答复)Click to see the answer key or go to the Table of Contents and click on the Answer Key under the 'Other Versions' option.
::单击可查看答题键, 或转到目录中, 单击“ 其他版本” 选项下的答题键 。 -
What is the median of the set of data?