4.10理解三维比例模型和设计
章节大纲
-
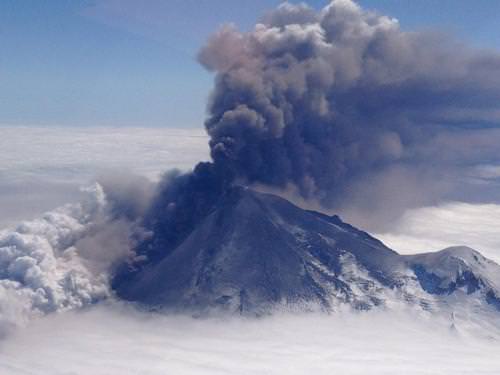
Nicholas is studying volcanoes. He is trying to determine the height of the volcano by looking at a contour map. Looking at the contour map, Nicholas counts 17 contour lines map scale indicates that a contour interval is equivalent to 400 feet. How can he find the height?
::尼古拉斯正在研究火山。 他正试图通过看一幅轮廓图来确定火山的高度。 看一看轮廓图,尼古拉斯计有17轮廓线地图比例表,显示一个轮廓间距相当于400英尺。 他如何找到高度?In this concept, you will learn to understand three-dimensional scale models and designs.
::在这个概念中,你会学会理解三维尺度模型和设计。Three-Dimensional Figures
::三维数字There are many different types of maps and models. If you work on interpreting two-dimensional maps, such as scale drawings and floor plans, you will use a scale to interpret measurements the actual dimensions and the scale dimensions. Two–dimensional representations mean that the things being represented can be easily shown in a flat plane.
::地图和模型种类多种多样。 如果你努力解释二维地图,比如比例图和平面图,你就会用一个比例来解释测量实际尺寸和尺度尺寸。 两种维面表示意味着代表的东西很容易在平面上显示。You can also have a three–dimensional method of display. A three–dimensional figure contains the length, width and height or depth. A scale model is a model used to represent a three–dimensional space.
::您也可以使用三维显示方法。 三维图包含长度、宽度和高度或深度。 比例模型是用来代表三维空间的模型。In order to find the actual dimensions from a scale model, you can set up and solve a proportion . The scale given in the model is the first ratio. The unknown length and the scale length is the second ratio. You compare the scale in the first ratio and you compare the two lengths in the second ratio.
::为了从比例尺模型中找到实际尺寸,您可以设置和解决比例尺。模型中给出的尺度是第一个比例尺。未知的长度和尺度长度是第二个比例尺。您比较第一个比例尺中的尺度,比较第二个比例尺中的两个长度。Let’s look at an example.
::让我们举个例子。Brianna is making a scale model of the White House using the scale . If the height of Brianna’s model is 42 cm, what is the height of the actual White House?
::布赖恩纳正在用1厘米=0.5米的等级来制作白宫的比重模型。 如果布赖恩纳的比重是42厘米,那么实际的白宫的比重是多少?First, set up a proportion. The scale in the drawing says that , therefore the proportion is:
::首先,设定比例比例。绘图中的比例尺表示1厘米=0.5米,因此比例是:1厘米=0.5米。Next, write the second ratio. You know the scale length is 42 cm. The unknown length is .
::接下来,写第二个比例。你知道缩放长度是42厘米。未知的长度是 x。Then, cross-multiply to solve for .The answer is 21.The height of the actual White House is 21 m.
::白宫的实际高度是21米When you want to show a map in a three-dimensional way, you use a topographic map. A topographic map is a type of map that shows not only the distances on the ground, but also the relief features of the area, such as mountains. The map uses contour lines to show the elevation of the area. Each contour line is a line of equal elevation or height. When contour lines are spread farther apart, the elevation is not as steep. Where contour lines are bunched close together, the elevation is steeper. Contour lines show the general shape of the terrain or land.
::当您想要用三维方式显示地图时,您会使用地形图。地形图是一种地图,不仅显示地面的距离,而且显示该地区的降幅特征,如山区。地图使用轮廓线显示区域的高度。每轮轮廓线是相等的高度或高度线。等距线更远时,高幅不那么陡峭。等距线相近时,高幅则更陡峭。等距线相近,高幅则更陡峭。光线线显示地形或土地的一般形状。Topographic maps may also use colors to represent different features. Blue represents water, green represents vegetation, and brown lines represent topographic contours.
::地形图也可能使用颜色代表不同的特征。 蓝色代表水,绿色代表植被,棕色线代表地形轮廓。You can interpret these maps by using the scale. There will be a scale to show what each distance on the map represents, just like other maps. There will also be a scale to tell you what each contour line represents.
::您可以使用比例尺来解释这些地图。 将有一个比例尺来显示地图上每个距离代表什么, 就像其他地图一样。 还将有一个比例尺来告诉您每条轮廓线代表什么 。Let’s look at an example.
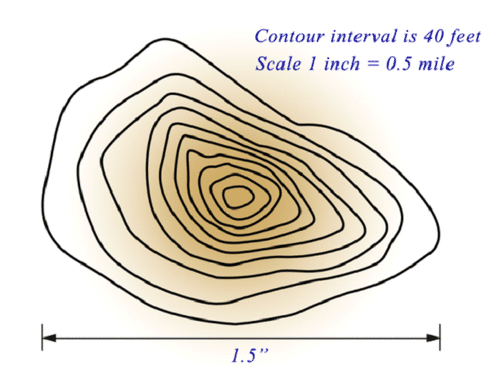
::让我们举个例子。This map below shows a mountain from a national park in California. What is the height of the mountain?
::下面的地图显示加利福尼亚州国家公园的一座山。 山高是多少?
First, look at the map scale. It states that the contour interval is 40 feet. That means that each contour line represents 40 feet of elevation.
::首先,请看地图比例尺。 它指出轮廓间距是40英尺。 这意味着每轮轮廓间距代表40英尺高。Next, count the number of contour lines that make up the mountain. There are 10 contour lines. Write a proportion to find the height of the mountain.
::接下来, 计数山顶的轮廓线数。 有 10 条轮廓线。 写一个比例以找到山顶 。Then, cross-multiply to solve for .
::然后,交叉倍数解答 x 。The answer is 400.
::答案是400The mountain is 400 feet high.
::那座山有400英尺高Examples
::实例Example 1
::例1Earlier, you were given a problem about Nicholas and his volcanoes.
::早些时候,你被给了 尼古拉斯和他的火山的问题。Nicholas is trying to determine the height of the volcano by looking at a contour map. He knows the map scale and the number of contour lines.
::Nicholas正试图通过看一幅轮廓图来确定火山的高度。他知道地图的大小和轮廓线的数目。First, from the map scale it states that the contour interval is 400 feet. That means that each contour line represents 400 feet of elevation.
::首先,从地图比例表上,它说轮廓间距为400英尺。这意味着每轮轮廓线代表400英尺高空。Next, write the proportion to find the height of the mountain for the 17 contour lines Nicholas counted.
::接下来,写下找到山峰高度的比例, 17条轮廓线由Nicholas计算。Then, cross-multiply to solve for ‘ ’.The answer is 6800.
::答案是6800The volcano is 6800 feet high.
::火山高6800英尺Example 2
::例2Mike is building a scale model of an airplane using the scale . If the actual length of the airplane is 150 feet, what will the length of the scale model be?
::Mike正在用 14 英寸 = 1英尺 来构建一个比例尺模型。 如果飞机的实际长度是 150 英尺, 比例尺模型的长度是 多少 ?First, set up a proportion. The scale for the model is .
::首先,设定比例。模型的比重为14英寸=1英尺。Next, cross-multiply to solve for .
::下一个, 交叉倍数解答 x 。The answer is 37.5.
::答案是37.5The scale model is 37.5 inches long.
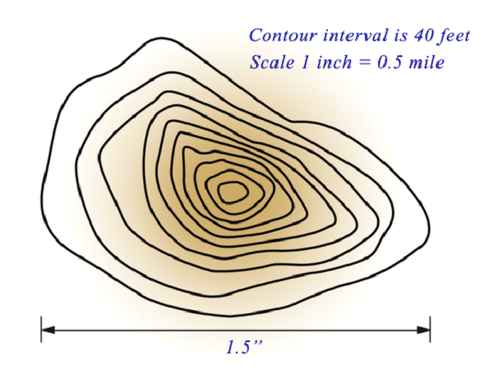
::比额表模式长37.5英寸。Use the contour lines in the diagram below to answer each question.
::使用下图中的轮廓线来回答每个问题。Example 3
::例3What height would be represented by 5 contour lines?
::5条轮廓线代表的高度是多少?First, look at the map scale. It states that the contour interval is 40 feet. That means that each contour line represents 40 feet of elevation.
::首先,请看地图比例尺。 它指出轮廓间距是40英尺。 这意味着每轮轮廓间距代表40英尺高。Next, write the proportion to find the height of 5 contour lines.
::接下来,写下比例以找到5等距线的高度。Then, cross-multiply to solve for .
::然后,交叉倍数解答 x 。The answer is 200.The height is 200 feet.
::高度是200英尺Example 4
::例4What height would be represented by 8 contour lines?
::8条轮廓线代表的高度是多少?First, look at the map scale. It states that the contour interval is 40 feet. That means that each contour line represents 40 feet of elevation.
::首先,请看地图比例尺。 它指出轮廓间距是40英尺。 这意味着每轮轮廓间距代表40英尺高。Next, write the proportion to find the height of 8 contour lines.
::接下来,写下比例以找到 8 等距线的高度 。Then, cross-multiply to solve for .
::然后,交叉倍数解答 x 。The answer is 320.
::答案是320The height is 320 feet.
::高度是320英尺Example 5
::例5What height would be represented by 3 contour lines?
::3条轮廓线代表的高度是多少?First, look at the map scale. It states that the contour interval is 40 feet. That means that each contour line represents 40 feet of elevation.
::首先,请看地图比例尺。 它指出轮廓间距是40英尺。 这意味着每轮轮廓间距代表40英尺高。Next, write the proportion to find the height of 3 contour lines.
::下一步,写入比例以找到 3 等距线的高度 。Then, cross-multiply to solve for .
::然后,交叉倍数解答 x 。The answer is 120.
::答案是120个The height is 120 feet.
::高度120英尺Review
::回顾Kevin built a scale model of a pool. He used the scale . Use this information to answer the following questions.
::Kevin建立了游泳池的标尺模型。 他使用了 12 英寸 = 5 英尺的标尺。 使用此信息回答下列问题 。1. The width of the pool on the scale model measures 1.5 inches. What is the actual width of the pool?
::1. 比例尺模型的池宽度为1.5英寸。 池的实际宽度是多少?2. The length of the pool on the scale model measures 2.5 inches. What is the actual length of the pool?
::2. 比额表模型的池长度为2.5英寸。 池的实际长度是多少?3. The depth of the pool on the scale model measures 0.5 inches. What is the actual volume of the pool.
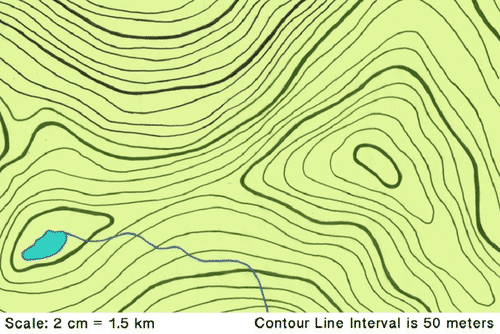
::3. 规模模型计量0.5英寸的池的深度。 池的实际体积是多少。This is a map of a national park. Use this information to answer the following questions.
::这是国家公园的地图。 使用此信息回答下列问题 。4. The distance of the length of the lake on the map is 1.5 cm. What is the actual distance of the length?
::4. 地图上湖泊长度的距离为1.5厘米。 实际距离是多少?5. Explain why the contour lines on the map are closer together at some points and farther apart at other points.
::5. 解释为什么地图上的轮廓线在某些点更加接近,在其他点更加相距甚远。Answer each of the following questions as true or false.
::回答下列问题中的每一个问题都是真实的或虚假的。6. A topographic map would include lakes and rivers.
::6. 地形图将包括湖泊和河流。7. A two–dimensional map could also be a topographic map.
::7. 两维地图也可以是地形图。8. Three–dimensions means including length, width and height.
::8. 3 - 秒是指长度、宽度和高度。9. Depending on what you are measuring, height might be replaced by depth.
::9. 视你衡量的高度而定,高度可能被深度取代。10. There is a proportional relationship between length and the area of a figure.
::10. 数字的长度和面积之间存在比例关系。11. A two–dimensional map also includes contour lines.
::11. 两维地图还包括轮廓线。12. Contour lines can be different sizes if there is a different elevation involved.
::12. 如果涉及不同的高度,轮廓线的大小可能不同。13. Elevation also means height.
::13. 升降还意味着身高。14. A topographic map can be built in three dimensions.
::14. 地形图可分为三个层面。