10.11 线性、指数和二次曲线模型
章节大纲
-
Linear, Exponential, and Quadratic Models
::线性、指数性和二次曲线模型In this course we’ve learned about three types of functions, linear, quadratic and exponential.
::我们学到了三种功能, 线性、二次和指数性。-
take the form
.
::中显示 Y=mx+b 的窗体。 -
Quadratic functions take the form
.
::二次曲线函数为y=ax2+bx+c。 -
take the form
.
::以 y=abx 的形式显示。
In real-world applications, the function that describes some physical situation is not given; it has to be found before the problem can be solved. For example, scientific data such as observations of planetary motion are often collected as a set of measurements given in a table. Part of the scientist’s job is to figure out which function best fits the data. In this section, you’ll learn some methods that are used to identify which function describes the relationship between the variables in a problem.
::在现实世界应用中,描述某些物理状况的功能没有给出;必须在问题得到解决之前找到。 例如,科学数据,例如行星运动观测,通常作为表格中给出的一组测量数据收集。科学家的部分工作是找出哪些功能最适合数据。在本节中,你将学习一些方法,用来确定哪些功能可以描述问题变量之间的关系。
Identify Functions Using Differences or Ratios
::使用差异或比率确定函数One method for identifying functions is to look at the difference or the ratio of different values of the dependent variable . For example, if the difference between values of the dependent variable is the same each time we change the independent variable by the same amount, then the function is linear .
::确定函数的一种方法是查看依附变量不同值的差异或比率。例如,如果依附变量之间的值差异与每次我们以相同数额改变独立变量时相同,则该函数为线性函数。Identifying Functions
::确定职能Determine if the function represented by the following table of values is linear.
::确定以下数值表所代表的函数是否线性。–4 –1 –1 0 2 1 5 2 8 If we take the difference between consecutive values, we see that each time the value increases by one, the value always increases by 3.
::如果我们采用连续的 y- 值之间的差别,我们看到,每次x- 值增加一倍, y- 值总是增加3倍。Since the difference is always the same, the function is linear.
::由于差别总是相同的,函数是线性的。When we look at the difference of the values, we have to make sure that we examine entries for which the values increase by the same amount.
::当我们查看y-值的差别时,我们必须确保我们检查X-值增加相同数额的条目。For example, examine the values in this table:
::例如,审查本表中的数值:0 5 1 10 3 20 4 25 6 35 At first glance this function might not look linear, because the difference in the values is not always the same. But if we look closer, we can see that when the value increases by 10 instead of 5, it’s because the value increased by 2 instead of 1. Whenever the value increases by the same amount, the value does too, so the function is linear.
::乍一看,这个函数可能看起来不像线性,因为 Y - 值的差别并不总是一样。但如果我们仔细看,我们可以看到,当 y - 值增加10 而不是 5, 这是因为 x - 值增加2 而不是 1. 当 x - 值增加相同数量时, y - 值也会增加, 所以函数是线性 。Another way to think of this is in mathematical notation. We can say that a function is linear if is always the same for any two pairs of and values. Notice that the expression we used here is simply the definition of the of a line.
::另一种思考方式是数学符号。 我们可以说, 如果 y2 - y1x2 - x1 对任何两对 x - 和 y - value 来说总是一样, 函数就是线性的。 请注意, 我们在这里使用的表达式只是线条的定义 。Differences can also be used to identify quadratic functions. For a quadratic function , when we increase the values by the same amount, the difference between values will not be the same. However, the difference of the differences of the values will be the same.
::差异也可以用来识别二次函数。对于二次函数,当我们以相同数量增加 x - 值时, y - 值之间的差不会相同。 但是, y - 值的差别是一样的 。Here are some examples of quadratic relationships represented by tables of values:
::以下是以数值表为代表的二次关系的一些例子:
In this quadratic function, , when we increase the value by one, the value of increases by different values. However, it increases at a constant rate , so the difference of the difference is always 2.
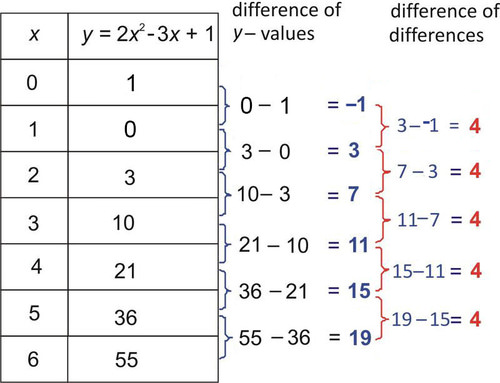
::在这个二次函数, y=x2 中, 当我们将 x - 值乘以一个时, y 值乘以不同的值, y 值乘以不同的值。 但是, 它会以恒定速率增长, 所以差差总是为 2 。In this quadratic function, , when we increase the value by one, the value of increases by different values. However, the increase is constant: the difference of the difference is always 4.
::在这个二次函数, y= 2x2-3x+1 中, 当我们将 x - 值乘以一, y 值乘以不同的值时, y 值乘以不同的值。 但是, 增长是恒定的: 差差总是为 4 。To identify exponential functions, we use ratios instead of differences. If the ratio between values of the dependent variable is the same each time we change the independent variable by the same amount, then the function is exponential.
::为了识别指数函数,我们使用指数函数比,而不是差异。如果从属性变量的数值比是相同的,那么当我们以相同数量改变独立的变量时,函数是用完的。Determining if a Function is Exponential
::确定函数是否为指数Determine if the function represented by each table of values is exponential.
::确定每个数值表代表的函数是否指数化。a)
::a) (a)
If we take the ratio of consecutive values, we see that each time the value increases by one, the value is multiplied by 3. Since the ratio is always the same, the function is exponential.
::如果我们采用连续的 y- 值比率,我们可以看到,每次x- 值增加1倍, y- 值乘以3。 由于该比率总是不变, 函数是指数化的 。b)
:b) b)

If we take the ratio of consecutive values, we see that each time the value increases by one, the value is multiplied by . Since the ratio is always the same, the function is exponential.
::如果我们采用连续的 y- 值比率,我们看到,每次x- 值增加1倍, y- 值乘以12。 由于该比率总是不变, 函数是指数化的 。Writing Equations for Functions
::函数的书写公式Once we identify which type of function fits the given values, we can write an equation for the function by starting with the general form for that type of function.
::一旦我们确定哪类函数符合给定值,我们就可以从该类型函数的一般形式开始,为该函数写一个方程。1. Determine what type of function represents the values in the following table.
::1. 确定哪类职能代表下表中的数值。0 5 1 1 2 -3 3 -7 4 -11 Let’s first check the difference of consecutive values of .
::让我们首先检查 y 连续值的差异 。
If we take the difference between consecutive values, we see that each time the value increases by one, the value always decreases by 4. Since the difference is always the same, the function is linear.
::如果我们采用连续的 y- 值之间的差别,我们看到,每次x- 值增加一倍,y- 值总是减少4倍。 由于差异总是相同的,函数是线性的。To find the equation for the function, we start with the general form of a linear function : . Since is the slope of the line, it’s also the quantity by which increases every time the value of increases by one. The constant is the value of the function when . Therefore , the function is .
::要找到函数的方程, 我们从线性函数的一般形式开始: y=mx+b。 由于 m 是线性函数的斜度, 也取决于 y 每次增加 x 增加一倍的值时 y 增加的数量。 常数 b 是 x=0 时函数的值。 因此, 函数是 y=4x+5 。2. Determine what type of function represents the values in the following table.
::2. 确定哪类职能代表下表中的数值。0 0 1 5 2 20 3 45 4 80 5 125 6 180 Here, the difference between consecutive values isn’t constant, so the function is not linear. Let’s look at those differences more closely.
::在这里,连续的 y- value 之间的差别不是固定的,所以函数不是线性。让我们更仔细地看这些差别。0 0 1 5 2 20 3 45 4 80 5 125 6 180 When the value increases by one, the difference between the values increases by 10 every time. Since the difference of the differences is constant, the function describing this set of values is quadratic.
::当 x - 值增加一倍时, y - 值之间的差 每次增加10 倍。 由于差异的差值是不变的, 描述此组值的函数是二次形的 。To find the equation for the function that represents these values, we start with the general form of a quadratic function: .
::要找到代表这些值的函数的方程式, 我们从四方函数的一般形式开始 : y=ax2+bx+c 。We need to use the values in the table to find the values of the constants: and .
::我们需要使用表中的值来找到常数的值:a、b和c。The value of represents the value of the function when , so .
::c 值代表当 x=0 时函数的值, 所以 c=0 。
::点中的插件(1,5):5=a+bplug 在点中的插件(2,20):20=4a+2b10=2a+b 寻找 a和b,我们解析方程系统:5=a+b10=2a+2a+bolve b:5=a+bb=5-alug 第二个方程:10=2a+5-aolve用于a和ba=5和b=0Therefore the equation of the quadratic function is .
::因此,二次函数的方程式是y=5x2。Example
::示例示例示例示例Example 1
::例1Determine what type of function represents the values in the following table.
::确定哪类函数代表下表中的数值。0 400 1 500 2 25 3 6.25 4 1.5625 The differences between consecutive values aren’t the same, and the differences between those differences aren’t the same either. So let’s check the ratios instead.
::连续的 y- value 之间的差异并不相同,这些差异的差异也不相同。 因此,让我们来检查一下比率。
Each time the value increases by one, the value is multiplied by . Since the ratio is always the same, the function is exponential.
::每次 x - 值增加一个, Y - 值乘以 14, 因为比率总是一样, 函数是指数化的 。To find the equation for the function that represents these values, we start with the general form of an exponential function , .
::要找到代表这些值的函数的方程式, 我们从指数函数的一般形式 y=abx 开始。Here is the ratio between the values of each time is increased by one. The constant is the value of the function when . Therefore, the function is .
::b 这是 y 每次 x 增加一个时 y 值之间的比。 常数 a 是 x=0 函数的值。 因此, 函数是 y= 400( 14) x 。Review
::回顾Determine whether the data in the following tables can be represented by a linear function.
::确定以下表格中的数据是否可用线性函数表示。1.
10 -3 7 -2 4 -1 1 0 -2 1 -5 2.
4 -1 3 0 2 1 3 2 6 3 11 3.
0 50 1 75 2 100 3 125 4 150 5 175 Determine whether the data in the following tables can be represented by a quadratic function.
::确定以下表格中的数据是否可由二次函数表示。4.
10 -5 2.5 0 0 5 2.5 10 10 15 22.5 5.
1 4 2 6 3 6 4 4 5 0 6 -6 6.
-27 -2 -8 -1 -1 0 0 1 1 2 8 3 27 Determine whether the data in the following tables can be represented by an exponential function.
::确定下列表格中的数据是否可以用指数函数表示。7.
0 200 1 300 2 1800 3 8300 4 25800 5 62700 8.
0 120 1 180 2 270 3 405 4 607.5 5 911.25 9.
0 4000 1 2400 2 1440 3 864 4 518.4 5 311.04 Determine what type of function represents the values in the following tables and find the equation of each function.
::确定哪些类型的函数代表以下表格中的数值,并查找每个函数的方程。10.
0 400 1 500 2 625 3 781.25 4 976.5625 11.
-3 -7 -2 -5 -1 -3 0 -1 1 1 2 12.
14 -2 4 -1 -2 0 -4 1 -2 2 4 3 14 Review (Answers)
::回顾(答复)Click to see the answer key or go to the Table of Contents and click on the Answer Key under the 'Other Versions' option.
::单击可查看答题键, 或转到目录中, 单击“ 其他版本” 选项下的答题键 。 -
take the form
.