10.6 使用箱口口舌笔来理解数据
章节大纲
-
A truck is carrying books packaged in boxes. The number of books in each box is recorded as shown.
::一辆卡车装有包装在箱子里的书籍,每个箱子的书籍数量按所示记录。15 1 20 7 15 8 3 20 8 16 3 4 13 17 20 9 6 16 22 12 6 19 7 9 10 15 9 18 19 15 14 15 2 28 10 17 7 10 8 8 a. Construct a box and whisker plot to represent the data .
::a. 构造用于代表数据的框和刻度图。b. What do you think is a “typical” number of books in a box? Justify your answer.
::b. 你认为一个盒子中的“典型”书籍数量是多少?c. Are their outliers ? Explain.
:c) 它们的外部线是外线吗?
In this concept, you will learn to use box-and-whisker plots to understand data.
::在这个概念中,你将学会使用纸箱和纸笔图来理解数据。Box and Whisker Plots
::插箱和口述口语笔At times it is useful to get a general idea of how data clusters together. Box-and-whisker plots display the distribution of data items along a number line. A box-and-whisker plot is created by determining five points. The data are divided into four equal parts, separated by points called quartiles . The smallest data point (the extreme minimum) and the largest data point (the extreme maximum) are also displayed on the graph.
::有时,了解数据组的组合方式是有用的。框和简略图显示数据项目在数字行的分布。通过确定五个点来创建框和简略图。数据分为四个相等部分,由四分位点(称为四分位点)分隔。最小数据点(最起码)和最大数据点(最高数)也显示在图表上。First, arrange the data in order from smallest to largest. Then, create a number line that shows the range of the data using equal intervals. Use the as the middle point on the box-and-whisker plot and to split the data in half. The median of each half, the quartile , is then calculated. These separate the data into quarters. Finally, use the smallest data value and the largest data value as the endpoints or extremes . Boxes are then drawn between the quartiles and whiskers are drawn to the extremes.
::首先,按最小到最大顺序排列数据。 然后, 创建一个数字行, 用相等的间隔来显示数据的范围。 使用框和断层图的中点来显示数据的范围, 然后将数据分割为一半。 然后计算每半个的中点, 即四分位数。 这些中位数将数据分为几个区块。 最后, 使用最小的数据值和最大的数据值作为终点或极端。 然后, 框在四分位数和胡须数之间绘制为最极端 。A box-and-whisker plot that is already constructed can quickly supply statistical measures by looking at the five points. The first and last points give the extremes of the data. The third or middle point gives the median of all the data. The second and fourth points, between the median and the extremes, give the quartiles.
::已经构造的方框和小插图可以通过查看五个点迅速提供统计计量。第一个点和最后一个点给出了数据的极端。第三个或中间点给出了所有数据的中位数。第二和第四点,介于中位数和极端数之间,给出了四分位数。The interquartile range is the range between the first quartile and the third quartile . This shows where the middle half of the data is located. It can be calculated by subtracting the first quartile from the third quartile.
::内径范围是第一个四分位数和第三个四分位数之间的范围。 它显示数据中半部分的位置。 可以从第三个四分位数中减去第一个四分位数来计算 。Finally, the outliers , data items that are far away from the general trend, can be located as extremes that cause the whiskers to be exceptionally long. Data does not always have outliers. If there isn’t a single point that is exceptionally far from other points, then an outlier doesn’t exist.
::最后,与一般趋势相去甚远的外部线,即数据项目,可以被定位为导致胡须异常长的极端线。 数据并不总是有外部线。 如果没有一个与其他点极为相距遥远的点,那么一个外部线就不存在了。Let’s look at an example.
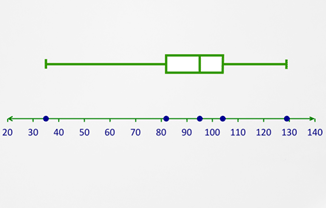
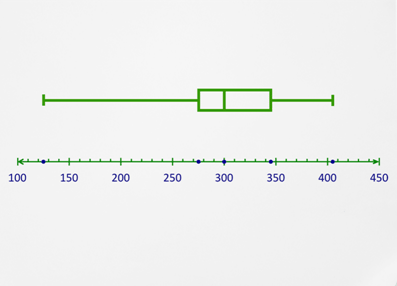
::让我们举个例子。Use the given box-and-whisker plot to identify: a) the extremes, b) the median, c) the quartiles, d) the interquartile range, and e) the outliers (if any).
::使用给定的盒子和耳机图来识别-
The extremes in this
data set
are approximately 35 and 129.
::这一数据集的极端情况约为35和129。 -
The median is approximately 95.
::中位数约为95。 -
The first quartile is approximately 82 and the third quartile approximately 104.
::第一个四分位数约为82个,第三个四分位数约为104个。 -
The interquartile range, then, is 104 – 82 or 22.
::内径范围为104 - 82 或 22。 -
Finally, the extreme
minimum
, 35, appears to be an outlier as the left whisker is very long compared to the rest of the plot.
::最后,最起码为35岁,这似乎是一个外缘,因为左翼的胡须与阴谋的其余部分相比很长。
Outliers are points that are unusually large or small compared to the rest of the data. When you discuss measures of central tendency like mean, median, and mode, you must also remember that in the real world there are many exceptions. Sometimes when you consider data, you might choose to remove the outliers in order to draw better conclusions based on the data.
::外部线指那些与数据其他部分相比异常大或小的点。当讨论中位值、中位数和模式等中心趋势的度量时,你还必须记住,在现实世界中有许多例外。有时,当你考虑数据时,你可能会选择删除外部线,以便根据数据得出更好的结论。Take a look at how removing an outlier can affect the interpretation of the data.
::研究删除外部线会如何影响数据的解释。Sandra runs on her school’s track team. They recently ran a 100 meter dash at a track meet and recorded official times. These are the results in seconds:
::Sandra在她的学校的轨道团队中运行。 他们最近在赛马场碰面时跑了100米, 记录了官方时间。11.7, 10.8, 11.1, 10.9, 11.7, 11.6, 12.0, 19.6, 12.2, 11.6, 11.5, 11.6, 11.0, 12.0, 11.6, 11.5, 11.7, 11.3, 12.3, 10.1.
Sandra’s time was 11.1 and she wants to know how she compares to the rest of her team. She will use a box-and-whisker plot to help figure this out.
::桑德拉的时间是11.1,她想知道她与团队其他成员相比有何不同。 她会用一个纸箱和口哨的阴谋来帮助解决问题。First, she places the data in order.
::首先,她把数据按顺序排列。10.1, 10.8, 10.9, 11.0, 11.1, 11.3, 11.5, 11.5, 11.6, 11.6, 11.6, 11.6, 11.7, 11.7, 11.7, 12.0, 12.0, 12.2, 12.3, 19.6
Next, she draws a number line that includes the extremes.
::接下来,她绘制一个包含极端的编号线。The extreme maximum is 19.6 and the extreme minimum is 10.1.
::最高为19.6,最低为10.1。The number line is drawn from 9 to 21.
::数字线从9至21间划出。Then, she finds the median and places this number on the number line.
::然后,她找到了中位数,然后把这个数字放在数字线上。The median is the middle data value. There are 20 data points. The 10 th and 11 th data values are both 11.6. The median is 11.6.
::中位数为中位数数据值。 中位数为 20 个数据点。 第 10 和第 11 个数据值为 11. 6 个中位数。 中位数为 11. 6 个中位数。Then, she finds the first and third quartiles and places these numbers on the number line.
::然后,她发现了第一和第二个四分位数 然后把这些数字放在数字线上She finds the median of the two groups above and below the median of the data set.
::她发现这两个组的中位数高于和低于数据集的中位数。Group 1:
::第1组:10.1, 10.8, 10.9, 11.0, 11.1, 11.3, 11.5, 11.5, 11.6, 11.6
::中位数=11.1+11.32=11.2Group 2:
::第2组:11.6, 11.6, 11.7, 11.7, 11.7, 12.0, 12.0, 12.2, 12.3, 19.6
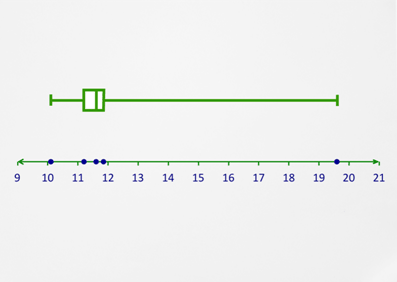
Then, she draws boxes between the quartiles and the median. She places the extremes, 10.1 and 19.6, on the numbers with points. She finally draws whiskers from the quartiles to the extremes.
::然后,她画了四分位数和中位数之间的盒子。她把极点,10.1和19.6放在带有点数的数字上。她最后从四分位数到极点都画了胡须。Her diagram is below.
::她的图表如下。When Sandra analyzes the box-and-whisker plot, she finds that her time, 11.1 seconds, is barely less than the first quartile. She knows that her friend, Teresa, is fast with a time of 10.1. Another teammate, Lisa, had fallen during the race but got up and continued to the finish line. Her time was 19.6.
::当Sandra分析盒子和口哨的图案时,她发现她的时间11.1秒比第一个四分位数还短。她知道她的朋友Teresa在10.1时的速度很快。另一个队友Lisa在比赛中倒下了,但爬到终点线。她的时间是19.6时。Sandra believes that neither Teresa nor Lisa’s scores are useful in gauging her speed. She decides to look at the same data but remove those two outliers.
::桑德拉认为泰瑞莎和丽莎的分数都不足以衡量她的速度。 她决定看同样的数据,但去掉这两个离线。Here’s her new data:
::以下是她的新数据:10.8, 10.9, 11.0, 11.1, 11.3, 11.5, 11.5, 11.6, 11.6, 11.6, 11.6, 11.7, 11.7, 11.7, 12.0, 12.0, 12.2, 12.3
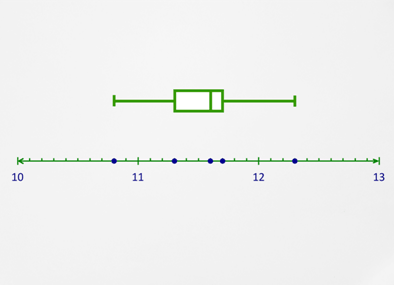
She recalculates her statistical measures and creates a new box-and-whisker plot:
::她重新计算她的统计计量, 并创造出一个新的盒子和口哨图:Extremes: 10.8 and 12.3
::极端极端:10.8和12.3Median: 11.6
::中中:11.6First and third quartiles: 11.3 and 11.7
::第一和第二四分位数:11.3和11.7When the two outliers are removed, Sandra can see that most of the data is grouped closely together. Her time, 11.1, is still in the first quartile. However, her competition is tight because the rest of the team isn’t far behind.
::当这两个外围线被移除时,桑德拉可以看到大部分数据被紧密地组合在一起。 她的时间是11.1,仍然在第一个四分之一。 然而,她的竞争很激烈,因为团队的其余部分并不远远落后。Examples
::实例Example 1
::例1Earlier, you were given a problem about the books in the boxes. The number of books in each box on the truck is recorded. These numbers are:
::早些时候,有人给了你一个有关箱子里书本的问题。记录了卡车上每个箱子里书本的数量。这些数字是:15, 1, 20, 7, 15, 8, 3, 20, 8, 16, 3, 4, 13, 17, 20, 9, 6, 16, 22, 12, 6, 19, 7, 9, 10, 15, 9, 18, 19, 15, 14, 15, 2, 28, 10, 17, 7, 10, 8, 8
You need to:
::您需要:a. Construct a box and whisker plot to represent the data.
::a. 构造用于代表数据的框和刻度图。b. What do you think is a “typical” number of books in a box? Justify your answer.
::b. 你认为一个盒子中的“典型”书籍数量是多少?c. Are their outliers? Explain.
:Let’s start with part a.
::让我们从第一部分开始。First, place the data in order.
::首先,把数据按顺序排列。1, 2, 3, 3, 4, 6, 6, 7, 7, 7, 8, 8, 8, 8, 9, 9, 9, 10, 10, 10, 12, 13, 14, 15, 15, 15, 15, 15, 16, 16, 17, 17, 18, 19, 19, 20, 20, 20, 22, 28
Next, draw a number line that includes the extremes.
::下一步,绘制包含极端的数条线。The extreme maximum is 28 and the extreme minimum is 1.
::最高限为28,最低限为1。The number line is drawn from 0 to 30.
::数字线从0到30之间划线。Then, find the median and place this number on the number line.
::然后找到中位数,然后把这个数字放在数字线上。The median is the middle data value. There are 40 data points. The 20 th and 21 st data values are 10 and 12. The median is 11.
::中位数是中位数数据值。有40个数据点。第20和21个数据值是10和12。中位数是11。Then, find the first and third quartiles and place these numbers on the number line.
::然后找到第一和第二四分位数 然后把这些数字放在数字线上Calculate the median of the two groups above and below the median of the data set.
::计算数据集中位数上下两个组的中位数。Group 1: 1, 2, 3, 3, 4, 6, 6, 7, 7, 7, 8, 8, 8, 8, 9, 9, 9, 10, 10, 10
::第1组:第1、2、3、3、4、6、6、7、7、7、7、8、8、8、8、8、9、9、9、9、10、10、10
::中位数=7+82=7.5Group 2: 12, 13, 14, 15, 15, 15, 15, 15, 16, 16, 17, 17, 18, 19, 19, 20, 20, 20, 22, 28
::第2组:12、13、14、15、15、15、15、15、15、16、16、16、17、17、18、19、19、20、22、20、22、28
::中位数=16+172=16.5Then, draw boxes between the quartiles and the median.
::然后在四分位数和中位数之间画个盒子Place the extremes, 1 and 28, on the numbers with points.
::在带有点数的数值上,将最极端 1 和 28 定位在点数上。Finally draws whiskers from the quartiles to the extremes.
::最后将小胡子从四角形划到最极端。The diagram is below.
::图表如下。Let’s now do part b.
::现在让我们来做B部分。Any point within the box would be typical.
::盒子内的任何点都是典型的。You could choose the median of 11 books as typical or even the mean of 12.
::您可以选择11本书的中位数作为典型,甚至选择12本的中位数。Finally, do part c.
::最后,完成C部分。An outlier is a data item that is far away from the general trend.
::外部数据项目与一般趋势相距甚远。Twenty-eight is not a typical value as it is much larger than the others. It is an outlier.
::28个不是典型的值,因为它比其他值大得多。Example 2
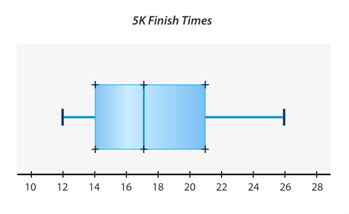
::例2The town hall held its annual 5k run. Here are the times of the finishers: 12 minutes, 13 minutes, 14 minutes, 15 minutes, 16 minutes, 17 minutes, 18 minutes, 19 minutes, 21 minutes, 23 minutes and 26 minutes.
::市政厅举行了每年5公里的比赛,这里是决赛时间:12分钟,13分钟,14分钟,15分钟,16分钟,17分钟,18分钟,19分钟,21分钟,23分钟,26分钟。Create a box-and-whisker plot to show the data.
::创建显示数据的纸箱和小费图 。First, find the extremes in the data.
::首先,找到数据中的极端。12, 13, 14, 15, 16, 17, 18, 19, 21, 23, 26
The extreme maximum is 26 and the extreme minimum is 12. The number line is drawn from 10 to 28.
::最高值为26,最低值为12,数字线从10线划为28线。Next, find the median and place this number on the number line.
::接下来,找到中位数,然后把这个数字放在数字行上。The median is the middle data value. There are 11 data points. The median is 17.
::中位数是中位数数据值。 有 11 个数据点。 中位数是 17 个数据点。Then, find the first and third quartiles and place these numbers on the number line.
::然后找到第一和第二四分位数 然后把这些数字放在数字线上Find the median of the two groups above and below the median of the data set.
::查找数据集中位数上下两组的中位数。Group 1: 12, 13, 14, 15, 16
::第1组:第1组:第12、13、14、15、16Median = 14
::中中=14Group 2: 18, 19, 21, 23, 26
::第2组:18、19、21、23、26Median = 21
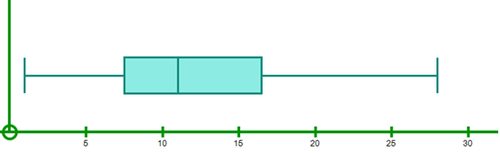
::中中=21Then, draw boxes between the quartiles and the median. Place the extremes, 12 and 26, on the numbers with points. Finally draw whiskers from the quartiles to the extremes.
::然后在四分位数和中位数之间绘制框。 将极点( 12 和 26) 放在带有点数的数字上。 最后从四分位数到极点之间绘制胡须 。The diagram is below.
::图表如下。Answer each question about box-and-whisker plots.
::回答每个问题 关于纸箱和耳机的地块。Example 3
::例3What is a value called when it is found very far away from the median?
::当发现它离中位数很远时,它被称为什么值?The answer is an outlier.
::答案是一个外层。Example 4
::例4Will removing an outlier change the median or the mean?
::去除一个外星能改变中位数还是中位数?The answer is that it will change both.
::答案是,这将改变两者。The median value will be different, and the first and third quartile values will be affected because the outlier will not be calculated as part of the average .
::中位值将有所不同,第一和第二个四分位值将受到影响,因为外位值不会作为平均值的一部分计算。Example 5
::例5Does a box-and-whisker plot always have quartiles?
::盒子和耳机的图案 总是有四分位数吗?The answer is yes.
::答案是肯定的。It is organized around the quartiles and the median.
::它围绕四分位数和中位数组织。Review
::回顾Define the following terms.
::界定以下术语。1. Box-whisker-plot
::1. 口插口插口笔2. Quartiles
::2. 采石3. Median
::3. 中4. Extremes
::4. 极端5. Interquartile Range
::5. 孔径距离6. Outliers
::6. 外部线Use the given box-and-whisker plot to answer the following questions.
::使用给定的纸箱和私密图解答下列问题。7. What is the median value?
::7. 中值是多少?8. Identify the quartiles.
::8. 确定四分位数。9. Identify the interquartile range.
::9. 确定孔径范围。10. Identify any extremes.
::10. 查明任何极端现象。Use the data set to answer each question.
::使用数据集回答每个问题。26, 27, 29, 30, 32, 35, 41, 42, 44
11. What is the median value?
::11. 中值是多少?12. Identify the lower quartile.
::12. 确定下四分位数。13. Identify the upper quartile.
::13. 识别上四分位数。14. Identify the lower extreme.
::14. 查明较低极端因素。15. Identify the upper extreme.
::15. 查明最高极端。Review (Answers)
::回顾(答复)Click to see the answer key or go to the Table of Contents and click on the Answer Key under the 'Other Versions' option.
::单击可查看答题键, 或转到目录中, 单击“ 其他版本” 选项下的答题键 。 -
The extremes in this
data set
are approximately 35 and 129.