2.12 垂直翻译
章节大纲
-
You are working on a graphing project in your math class, where you are supposed to graph several functions. You are working on graphing a cosine function, and things seem to be going well, until you realize that there is a bold, horizontal line two units above where you placed your "x" axis! As it turns out, you've accidentally shifted your entire graph. You didn't notice that your instructor had placed a bold line where the "x" axis was supposed to be. And now, all of the points for your graph of the cosine function are two points lower than they are supposed to be along the "y" axis.
::您正在数学类中做一个图形化工程, 您应该在其中绘制多个函数。 您正在绘制一个正弦函数的图形, 并且事情似乎进展顺利, 直到您意识到在您放置您的“ X” 轴的上面有一个粗体水平的线条两个单位。 事实证明, 您无意中移动了您的整个图形。 您没有注意到您的导师设置了一个粗体线, “ x” 轴应该在那里。 而现在, 您的连弦函数图的所有点都比“ y” 轴上要低两点 。You might be able to keep all of your work, if you can find a way to rewrite the equation so that it takes into account the change in your graph.
::你也许可以保留你所有的工作, 如果你能找到一种方法来重写方程式, 以便它能考虑到你图表中的变化。Can you think of a way to rewrite the function so that the graph is correct the way you plotted it?
::您能否想出一种方法来重写函数, 使图表与您绘制的方式相一致 ?Vertical Translations
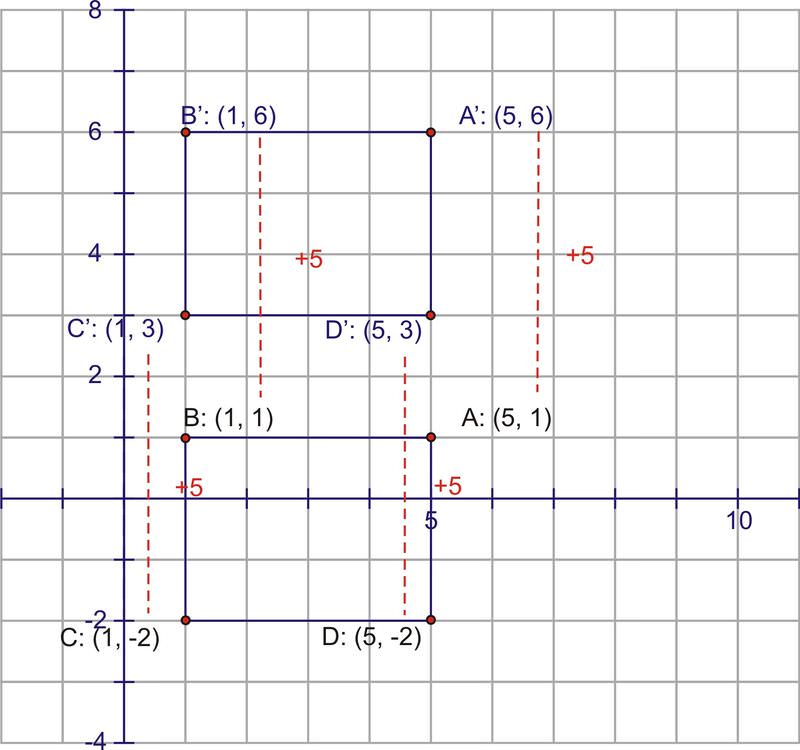
::垂直翻译When you first learned about vertical translations in a coordinate grid, you started with simple shapes. Here is a rectangle:
::当您第一次在坐标网格中学习垂直翻译时, 您从简单的形状开始。 这里有一个矩形 :To translate this rectangle vertically, move all points and lines up by a specified number of units. We do this by adjusting the coordinate of the points. So to translate this rectangle 5 units up, add 5 to every coordinate.
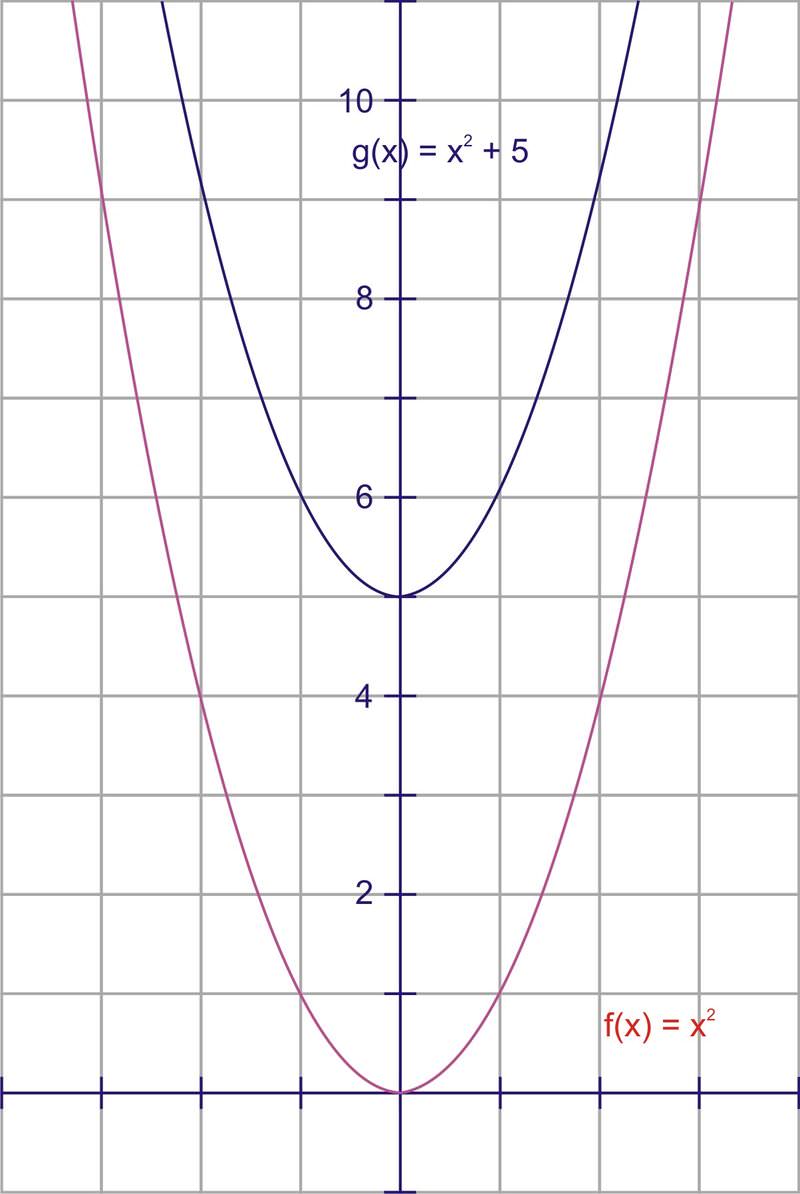
::要垂直翻译此矩形, 请将所有点和线条由指定数量的单位向上移动。 我们通过调整点的 Y - 坐标来做到这一点。 所以要将矩形 5 单位向上翻译, 每个 y - 坐标增加 5 个 。This process worked the same way for functions. Since the value of a function corresponds to the value on its graph, to move a function up 5 units, we would increase the value of the function by 5. Therefore, to translate up five units, you would increase the value by 5. Because is equal to , then the equation , will show this translation.
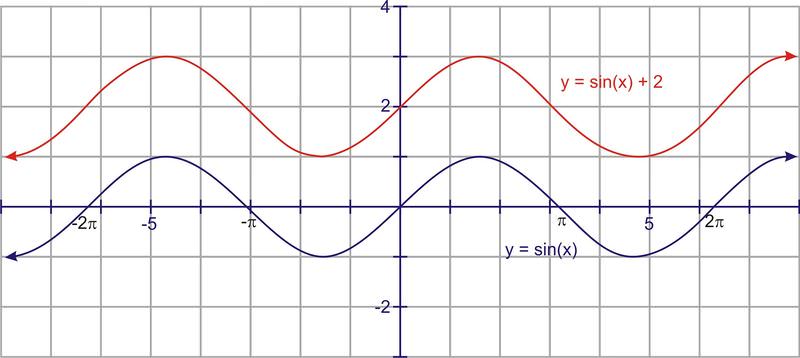
::此进程对函数同样有效。 由于函数的值与其图形上的 y- value 对应, 要将函数向上移动5 个单位, 我们会将函数的值增加5 。 因此, 要将 y=x2 向上移动5 个单位, 您将会将 Y- value 增加5 个单位。 因为 y 等于 x2, 那么公式 y=x2+5 将会显示此翻译 。Hence, for any graph, adding a constant to the equation will move it up, and subtracting a constant will move it down. From this, we can conclude that the graphs of and will follow the same rules. That is, the graph of will be the same as , only it will be translated, or shifted, 2 units up.
::因此,对于任何图表,在方程式中添加一个常数会将其向上移动,而减去一个常数会将其向下移动。从这一点,我们可以得出结论,y=sinx和y=cosx的图形将遵循相同的规则。也就是说,y=sin(x)+2的图形将和y=sinx相同,只有它会被翻译或移动到两个单位上方。To avoid confusion, this translation is usually written in front of the function: .
::为了避免混乱,此翻译通常在函数Y=2+sinx前面撰写。Various texts use different notation, but we will use as the constant for vertical translations. This would lead to the following equations: and where is the vertical translation . can be positive or negative .
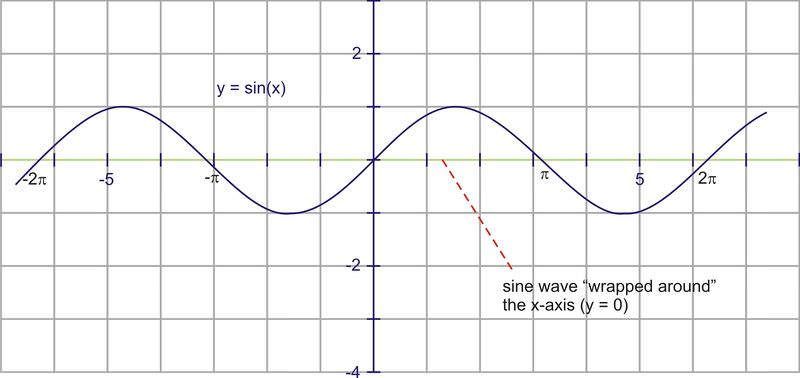
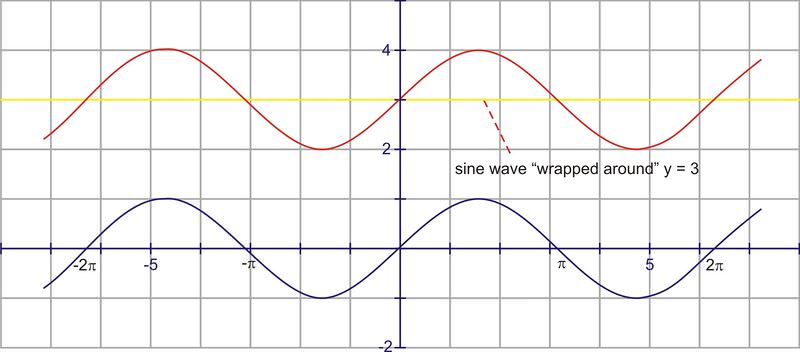
::各种文本使用不同的符号, 但我们将使用 D 作为垂直翻译的常数 。 这将导致以下方程式 : y = D sinx 和 y = D cosx , 其中 D 是垂直翻译 。 D 可以是正的, 也可以是负的 。Another way to think of this is to view sine or cosine curves “wrapped” around a horizontal line. For and , the graphs are wrapped around the axis, or the horizontal line, .
::另一种思考方式是查看横线周围的正弦或余弦曲线。对于 y=sinx 和 y=cosx, 图形环绕 x- 轴或水平线, y=0 。For , we know the curve is translated up 3 units. In this context, think of the sine curve as being “wrapped” around the line, .
::对于 y= 3+sinx, 我们知道曲线被翻译为 3 个单位。 在此情况下, 将正弦曲线视为 y= 3 的“ 包装 ” 。Either method works for the translation of a sine or cosine curve. Pick the thought process that works best for you.
::两种方法都可以用于正弦曲线或正弦曲线的翻译。 选择最适合您的思维过程 。Let's take a look at a few problems involving vertical translations.
::让我们来研究一下关于垂直翻译的一些问题。1. Find the minimum and maximum of
::1. 确定y6+cosx的最小值和最大值This is a cosine wave that has been shifted down 6 units, or is now wrapped around the line . Because the graph still rises and falls one unit in either direction, the cosine curve will extend one unit above the “wrapping line” and one unit below it. The minimum is and the maximum is .
::这是已向下移动了6个单位的余弦波,或者现在被环绕在Y6线上。由于图形仍然向任一方向上升和下降一个单位,余弦曲线将把一个单位延伸至“包装线”以上和一个单位以下。最小值为-7,最大值为-5。2. Graph .
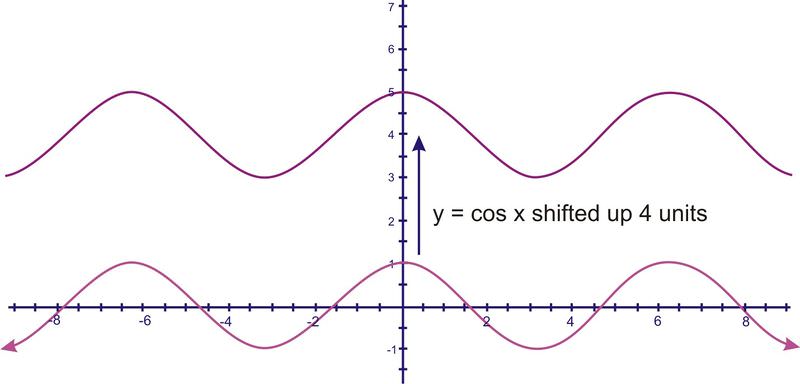
::2. 图y=4+cosx。This will be the basic cosine curve, shifted up 4 units.
::这将是基本余弦曲线, 向4个单位移动。3. Find the minimum and maximum of
::3. 确定y=sinx+3的最小值和最大值This is a sine wave that has been shifted up 3 units, so now instead of going up and down around the 'x' axis, it will go up and down around the line y = 3. Since the sine function rises and falls one unit in each direction, the new minimum is 2 and the new maximum is 4.
::这是一个正弦波,已经向上移动了3个单位,所以现在,它不是沿着“x”轴上下移动,而是沿着y = 3线上下移动,因为正弦函数在每个方向上上升并下降一个单位,新的最小值是2,新的最大值是4。Examples
::实例Example 1
::例1Earlier, you were asked if you can think of a way to rewrite the function so that the graph is correct the way you plotted it.
::早些时候,有人问您是否可以想出一种方法来重写函数,以使图表与您绘制的方式相一致。Since you now know how to shift a graph vertically by adding or removing a constant after the function, you can keep your graph by changing the equation to
::既然您现在知道如何在函数后添加或删除一个常数, 垂直移动图形, 您可以通过将方程式更改为 y=cos( x)- 2 来保持图形。Example 2
::例2Which of the following is true for the equation:
::公式为 y=sin(x2) , 下列哪一个是真实的 : y=sin(x2)The minimum value is 0.
::最小值为 0 。The maximum value is 3.
::最大值为3。The intercept is -2.
::y - interview is - 2 。 y - interview is - 2. y - interviews is - 2. y - interview y - interviews is - 2. y - interviews is - 2. y - interviews is - 2. y - interviews is - 2. yThe intercept is -1.
::y - interview is - 1 。 y - interview is - 1 . y - interviews is - 1 .This is the same graph as .
::这是y=cos(x) 相同的图形 。"This is the same graph as ." is the answer to this question, since the is a shift to the graph which makes it the same as a cosine graph.
::“这是与 y=cos(x) 相同的图形。” 是这个问题的答案, 因为 2 是向图形的转换, 使得它与 cosin 图形相同 。Example 3
::例3Which of the following is true for the equation:
::以下哪一个对方程是真实的 : y= 1+sinxThe minimum value is 0.
::最小值为 0 。The maximum value is 3.
::最大值为3。The intercept is -2.
::y - interview is - 2 。 y - interview is - 2. y - interviews is - 2. y - interview y - interviews is - 2. y - interviews is - 2. y - interviews is - 2. y - interviews is - 2. yThe intercept is -1.
::y - interview is - 1 。 y - interview is - 1 . y - interviews is - 1 .This is the same graph as .
::这是y=cos(x) 相同的图形 。"The minimum value is 0." is the answer to this question, since this graph is the same as a regular sine graph, which ranges from -1 to 1, but shifted upward one unit on the "y" axis, so it ranges from 0 to 2.
::“最小值为 0 ” 是这个问题的答案, 因为此图与正正弦图相同, 它在 - 1 到 1 之间, 但向上移动了一个单位在“ Y” 轴上, 所以从 0 到 2 之间 。Example 4
::例4Which of the following is true for the equation:
::以下哪一个对方程是真实的 : y= 2+cosxThe minimum value is 0.
::最小值为 0 。The maximum value is 3.
::最大值为3。The intercept is -2.
::y - interview is - 2 。 y - interview is - 2. y - interviews is - 2. y - interview y - interviews is - 2. y - interviews is - 2. y - interviews is - 2. y - interviews is - 2. yThe intercept is -1.
::y - interview is - 1 。 y - interview is - 1 . y - interviews is - 1 .This is the same graph as .
::这是y=cos(x) 相同的图形 。"The maximum value is 3." is the answer to this question, since a cosine graph (which normally ranges between -1 and 1) shifted upward by two units. Therefore its new range is from 1 to 3.
::“最大值为3”是这个问题的答案,因为一个正弦图(通常介于-1至1之间)向上移动了两个单位。因此,它的新范围为1至3。Review
::回顾Use vertical translations to graph each of the following functions.
::使用垂直翻译来图形显示下列函数的每一项。-
::y=x3+4 y=x3+4 -
::y=x2 - 3 y=x2 - 3 -
::y=sin%(x)- 4 -
::y=cos(x)+7 -
::y=tan(x)+2 -
::y=3+sin(x) -
::y=cos(x)+1 -
::y= 6+sec(x) -
::y=tan(x)- 4
Find the minimum and maximum value of each of the following functions.
::查找以下每个函数的最小值和最大值。-
::y=sin(x)+6 -
::y=cos%(x)- 1 -
::y=sin%(x)- 4 -
::y3+cos(x) -
::y=2+cos(x) -
Give an example of a sine function with a y-intercept of 6.
::举个例子来说明正弦函数的 Y 插口为 6 。 -
Give an example of a cosine function with a maximum of -1.
::举一个最多为 -1 的余弦函数的例子。 -
Give an example of a sine function with a minimum of 0.
::举一个最小为 0 的正弦函数的例子。
Review (Answers)
::回顾(答复)Click to see the answer key or go to the Table of Contents and click on the Answer Key under the 'Other Versions' option.
::单击可查看答题键, 或转到目录中, 单击“ 其他版本” 选项下的答题键 。 -