2.13 水平翻译或分阶段转换
章节大纲
-
You are working on a graphing project in your math class, where you are supposed to graph several functions. Things seem to be going well, until you realize that there is a bold, vertical line three units to the left of where you placed your "y" axis! As it turns out, you've accidentally shifted your entire graph. You didn't notice that your instructor had placed a bold line where the "y" axis was supposed to be. And now, all of the points for your graph of the cosine function are three points farther to the right than they are supposed to be along the "x" axis.
::您正在数学课上做一个图形化工程, 您应该在其中绘制数个函数。 事情似乎进展顺利, 直到您意识到在您设置“ y” 轴的左边有一个大胆的垂直线条 3 单位。 事实证明, 您不小心移动了您的整个图形。 您没有注意到您的导师设置了一个粗线, 您的“ y” 轴应该在那里。 而现在, 您的连弦函数图的所有点都离右三点, 比它们应该沿着“ x” 轴更远 。You might be able to keep all of your work, if you can find a way to rewrite the equation so that it takes into account the change in your graph.
::你也许可以保留你所有的工作, 如果你能找到一种方法来重写方程式, 以便它能考虑到你图表中的变化。Can you think of a way to rewrite the function so that the graph is correct the way you plotted it?
::您能否想出一种方法来重写函数, 使图表与您绘制的方式相一致 ?Horizontal Translations
::水平翻译Horizontal translations involve placing a constant inside the argument of the trig function being plotted. If we return to the example of the parabola, , what change would you make to the equation to have it move to the right or left? Many students guess that if you move the graph vertically by adding to the value, then we should add to the value in order to translate horizontally. This is correct, but the graph itself behaves in the opposite way than what you may think.
::水平翻译包括在所绘制的三角函数参数的参数内放置一个常数。 如果我们返回到 parbola 的示例, y=x2, 那么对等方程作什么改变才能将其移动到右边或左边? 许多学生猜测, 如果您垂直移动图形, 添加到 y - value , 那么我们应该在 x - value 中添加一个常数, 以便横向翻译。 这是正确的, 但图形本身的行为方式与您想象的相反 。Here is the graph of .
::这里是 y= (x+2) 2 的图形 。Notice that adding 2 to the value shifted the graph 2 units to the left , or in the negative direction.
::注意在 x - 值中添加 2 将图2 单位向左或向负方向移动。To compare, the graph moves the graph 2 units to the right or in the positive direction.
::为了比较,图y=(x-2)2 将图2单位向右移动或向正方向移动。We will use the letter to represent the horizontal shift value. Therefore, subtracting from the value will shift the graph to the right and adding will shift the graph units to the left .
::我们将使用字母 C 来表示水平转换值。 因此, 从 x - 值中减去 C 将会将图表移到右边, 添加 C 将会将图形 C 单位移到左边 。Adding to our previous equations, we now have and where is the vertical translation and is the opposite sign of the horizontal shift.
::添加到我们以前的方程式中, 我们现在有 y= Dsin( xC) 和 y= Dcos( xC) , D 是垂直翻译, C 是水平转换的相反符号 。Sketching Graphs
::切入图1. Sketch
::1. 草图 y=sin (x2)This is a sine wave that has been translated units to the right .
::这是将% 2 单位转换为右侧的正弦波 。Horizontal translations are also referred to as phase shifts . Two waves that are identical, but have been moved horizontally are said to be “out of phase” with each other. Remember that cosine and sine are really the same waves with this phase variation.
::水平翻译也被称为“ 平移 ” 。 两波相同, 但被水平移动的两波据说是“ 淘汰 ” 。 记住正弦和正弦是真正相同的波, 与此阶段的变异相同 。can be thought of as a cosine wave shifted horizontally to the right by radians.
::y=sinx 可以被看作 2 弧度水平向右移动的余弦波。Alternatively, we could also think of cosine as a sine wave that has been shifted radians to the left.
::或者,我们也可以将余弦作为正弦波,将2弧度移到左边。2. Draw a sketch of
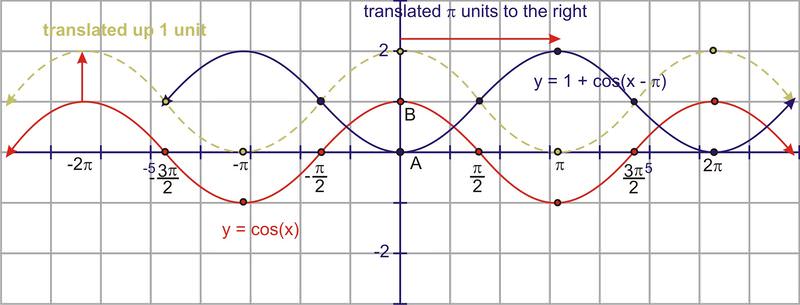
::2. 绘制y=1+cos(x)的草图This is a cosine curve that has been translated up 1 unit and units to the right. It may help you to use the quadrant angles to draw these sketches. Plot the points of at (as well as the negatives), and then translate those points before drawing the translated curve. The blue curve below is the final answer.
::这是一个已将一个单位和% 单位翻到右边的余弦曲线。 它可以帮助您使用象数角度绘制这些草图。 将 y=cosx 的点绘制为 0,%2, , 32, 2( 以及负数) , 然后在绘制所翻译的曲线之前将这些点翻译出来。 下面的蓝色曲线是最后答案 。Graphing Functions
::图图函数Graph
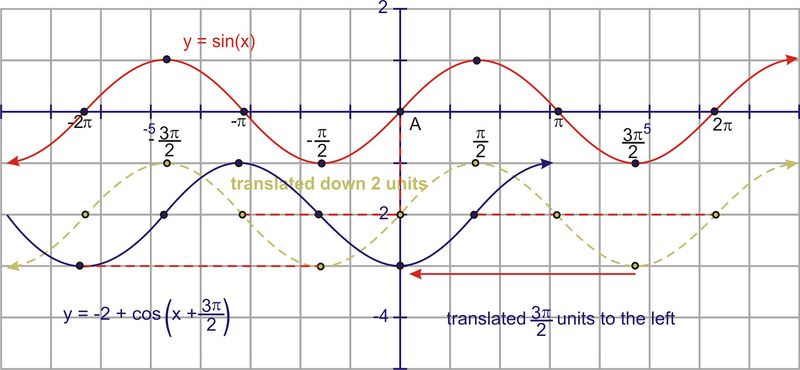
::y2+sin(x+32)This is a sine curve that has been translated 2 units down and moved radians to the left. Again, start with the quadrant angles on and translate them down 2 units.
::这是一个正弦曲线, 已经将 2 个单位向下翻转, 并将 3°2 弧度向左移动。 再一次, 从 y = sinx 上的 象限角度开始, 将其向下翻转 2 个单位 。Then, take that result and shift it to the left. The blue graph is the final answer.
::然后,取这个结果,然后将它移到左侧。蓝色图是最后答案。Examples
::实例Example 1
::例1Earlier, you were asked if you can think of a way to rewrite the function so that the graph is correct the way you plotted it.
::早些时候,有人问您是否可以想出一种方法来重写函数,以使图表与您绘制的方式相一致。As you've now seen by reading this Concept, it is possible to shift an entire graph to the left or the right by changing the argument of the graph.
::正如你现在通过阅读这个概念所看到的那样, 可以通过改变图的参数, 将整张图向左或向右移动。So in this case, you can keep your graph by changing the function to
::所以在这种情况下, 您可以通过将函数更改为 y=cos( x- 3) 来保留您的图表 。Example 2
::例2Draw a sketch of
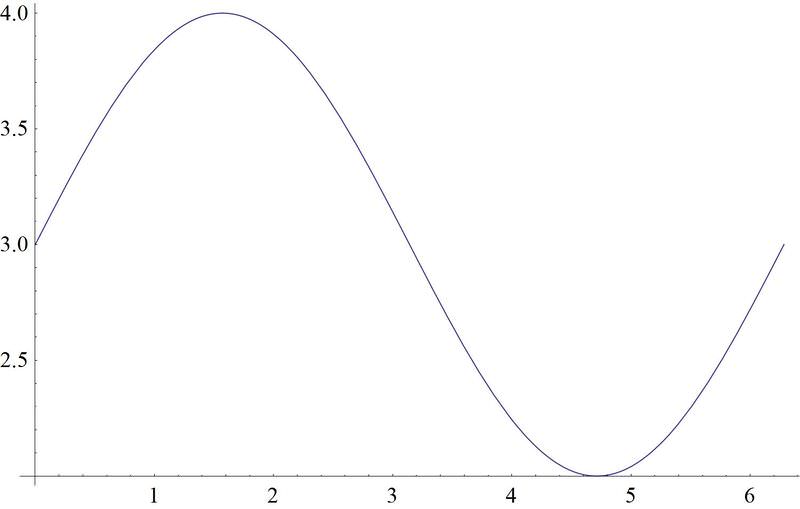
::绘制 y= 3+cos\\\ (x\\\\ 2) 的草图As we've seen, the 3 shifts the graph vertically 3 units, while the shifts the graph to the right by units.
::正如我们所看到的,3 将图形垂直移动3 个单位, 而% 2 将图向右移 由% 2 个单位。Example 3
::例3Draw a sketch of
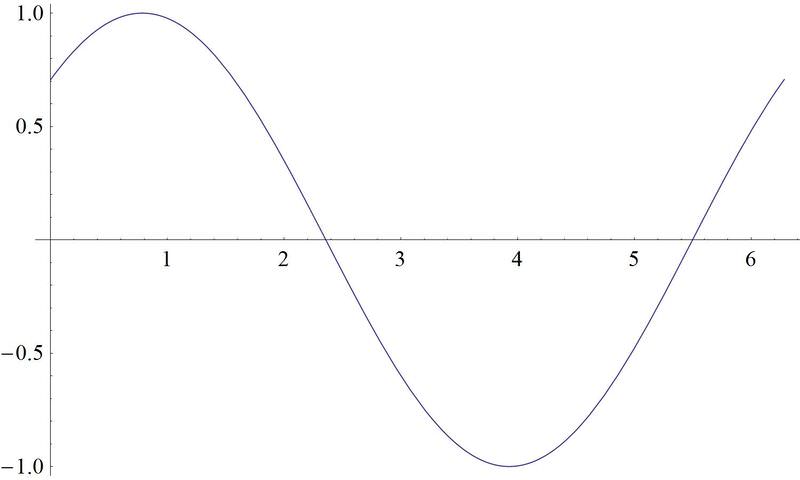
::绘制 y=sin 的草图( x% 4)The shifts the graph to the left by .
::4 将图向左移动 4 。Example 4
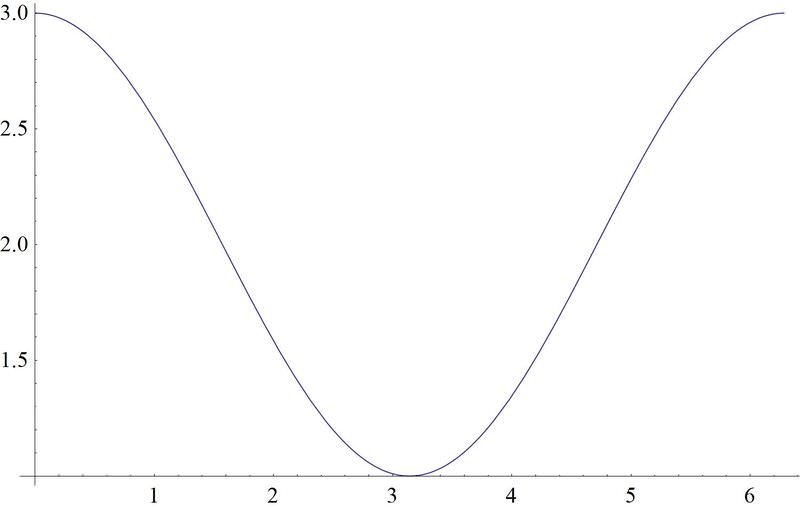
::例4Draw a sketch of
::绘制 y= 2+cos @ (x+2) 的草图The 2 added to the function shifts the graph up by 2 units, and the added in the argument of the function brings the function back to where it started, so the cosine graph isn't shifted horizontally at all.
::函数中添加的 2 将图形向上移动 2 个单位, 而函数参数中添加的 2 将函数带回它开始的位置, 所以余弦图形不会横向移动 。Review
::回顾Graph each of the following functions.
::绘制下列函数的每一个图。-
::y=cos(x2) -
::y=sin(x+42) -
::y=cos(x4) -
::y=cos(x-34) -
::y1+cos(x4) -
::y=1+sin(x2) -
::y2+cos(x4) -
::y=3+cos(x-32) -
::y=sec(x- 54) -
::y=3+csc(x2) -
::y=2+tan(x4) -
::y3+cot(x-32) -
::y=1+cos(x-34) -
::y=5+sec(x2) -
::y1+csc(x4) -
::y=3+tan(x-32)
Review (Answers)
::回顾(答复)Click to see the answer key or go to the Table of Contents and click on the Answer Key under the 'Other Versions' option.
::单击可查看答题键, 或转到目录中, 单击“ 其他版本” 选项下的答题键 。 -