2.14 振幅
章节大纲
-
While working on a sound lab assignment in your science class, your instructor assigns you an interesting problem. Your lab partner is assigned to speak into a microphone, and you are to record how "loud" the sound is using a device that plots the sound wave on a graph. Unfortunately, you don't know what part of the graph to read to understand "loudness". Your instructor tells you that "loudness" in a sound wave corresponds to "amplitude" on the graph, and that you should plot the values of the amplitude of the graph that is being produced.
::在你的科学课上做一个音响实验室任务时, 你的导师指派了你一个有趣的问题。 你的实验伙伴被指派用麦克风说话, 您要记录这个声音是如何使用一个“ 可爱” 的装置在图形上绘制声波的。 不幸的是, 您不知道图表的哪个部分可以读懂“ 优美 ” 。 您的导师告诉您, 声音波中的“ 优美” 与图形中的“ 温和 ” 相对应, 您应该绘制正在生成的图形的振幅值 。Here is a picture of the graph:
::以下是图表的图片 :Amplitude
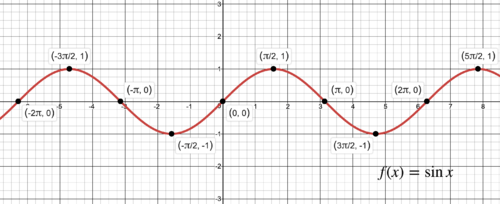
::振幅The amplitude of a wave is basically a measure of its height. Because that height is constantly changing, amplitude can be different from moment to moment. If the wave has a regular up and down shape, like a cosine or sine wave, the amplitude is defined as the farthest distance the wave gets from its center. In a graph of , the wave is centered on the axis and the farthest away it gets (in either direction) from the axis is 1 unit.
::海浪的振幅基本上是其高度的量度。 由于高度在不断变化, 振幅会随时间而变化。 如果海浪有正向上向下的形状, 如连弦或正弦波, 振幅的定义是波从波的中心距离最远。 在 f( x) =sinx 的图表中, 海浪以 x- 轴为中心, 距离轴最远的( 在两个方向) 则为 1 单位 。
So the amplitude of (and ) is 1.
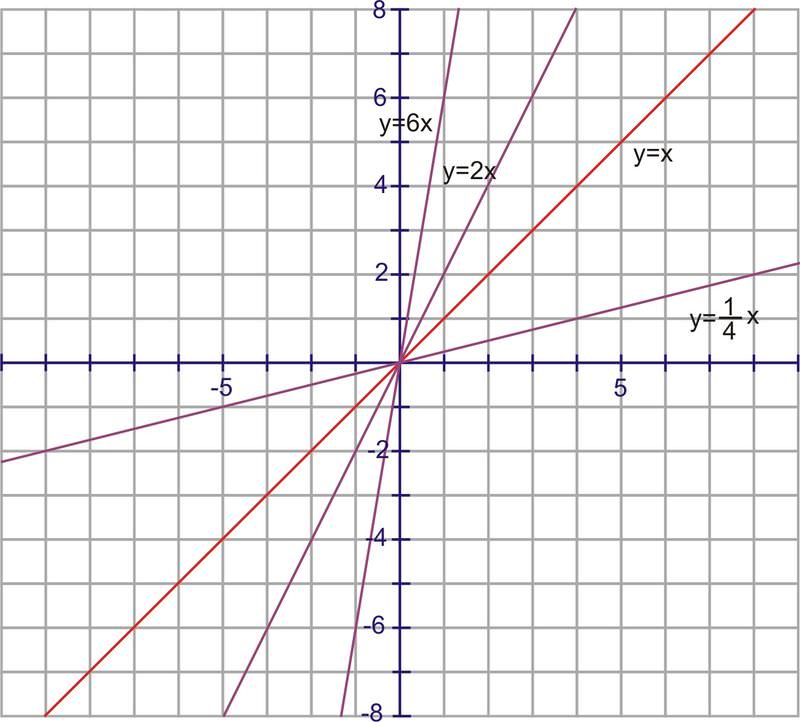
::F(x) =sinx (和 f(x) =cosx) 的振幅是 1 。Recall how to transform a linear function, like . By placing a constant in front of the value, you may remember that the slope of the graph affects the steepness of the line.
::回想如何转换线性函数, 如 Y=x 。 通过在 x 值前放置一个常数, 您可以记住, 图形的斜度会影响线条的陡度 。The same is true of a parabolic function, such as . By placing a constant in front of the , the graph would be either wider or narrower. So, a function such as , has the same parabolic shape but it has been “smooshed,” or looks wider, so that it increases or decreases at a lower rate than the graph of .
::y=x2 等抛物线函数的情况也是如此。 通过在 x2 前面放置一个常数, 图形会扩大或缩小。 因此, y= 18 x2 等函数具有相同的抛物线形状, 但它已经“ 溶化 ” , 或看起来更宽, 因而其增减速度低于 y=x2 的图形。No matter the basic function; linear, parabolic, or trigonometric, the same principle holds. To dilate (flatten or steepen, wide or narrow) the function, multiply the function by a constant. Constants greater than 1 will stretch the graph vertically and those less than 1 will shrink it vertically.
::无论基本函数为何;线性函数、抛物线函数或三角函数,原理相同。要放大函数(斜度或斜度,宽度或窄度)函数,函数乘以常数。大于1的常数将垂直伸展图形,小于1的常数将垂直缩缩缩。Look at the graphs of and .
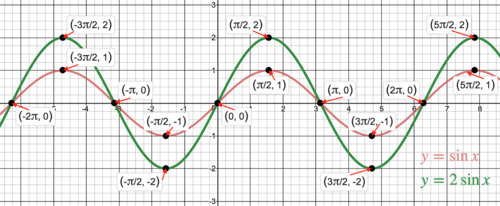
::看看y=sinx和y=2sinx的图表。
Notice that the amplitude of is now 2. An investigation of some of the points will show that each value is twice as large as those for . Multiplying values less than 1 will decrease the amplitude of the wave as in this case of the graph of :
::注意 y= 2sinx 的振幅现在是 2 。 对其中某些点的调查将显示, y- 值是y=sinx 的两倍。 乘数值小于 1 将会降低波的振幅, 与 y= 12sinx 的图案相比 :Finding the Amplitude
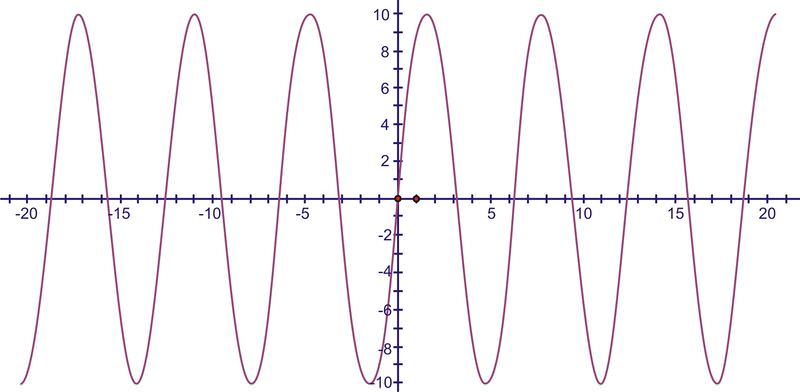
::寻找宽度Determine the amplitude of .
::确定 f(x) = 10sinx 的振幅 。The 10 indicates that the amplitude, or height, is 10. Therefore, the function rises and falls between 10 and -10.
::10表示振幅或高度为10,因此,函数在10至10之间上升和下降。Graphing Functions
::图图函数1. Graph
::1. 图g(x)+5cosxEven though the 5 is negative, the amplitude is still positive 5. The amplitude is always the absolute value of the constant . However, the negative changes the appearance of the graph. Just like a parabola, the sine (or cosine) is flipped upside-down. Compare the blue graph, , to the red parent graph, .
::5. 振幅始终是常数 A 的绝对值。 然而, 负值会改变图的外观。 正弦( 或正弦) 向上翻转, 和 parabola 一样, 正弦( 或 cosine) 向下翻转。 比较蓝色图形 g( x)\\\\\ 5cosx , 与 红父形 f( x) =cosx 。So, in general, the constant that creates this stretching or shrinking is the amplitude of the sinusoid. Continuing with our equations from the previous section, we now have or . Remember, if , then the graph is shrunk and if , then the graph is stretched. And, if is negative, then the graph is flipped.
::因此,一般而言,造成这种伸展或缩小的常数是正弦形的振幅。 继续前一节的等式, 我们现在有 y = D Asin( xC) 或 y = D Acos( xC) 。 记住, 如果 0 A1, 图表就会缩小, 如果 A1, 图形就会被拉伸。 如果 A 是负的, 则图形会被翻转 。2. Graph
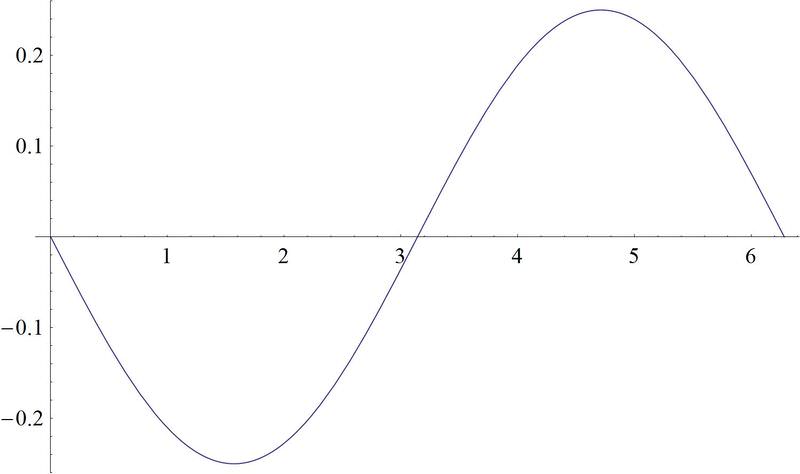
::2. 图h(x)_________________________________________________________________________________________________________________________________________________________________________________________________________________________________________________________________________________________________________________________________________________________________________________________________________________________________________________________________________________________________________________________________________As you can see from the graph, the negative inverts the graph, and the makes the maximum height the function reaches reduced from 1 to .
::从图中可以看到,负反转图,而14使函数的最大高度从1降到14。Examples
::实例Example 1
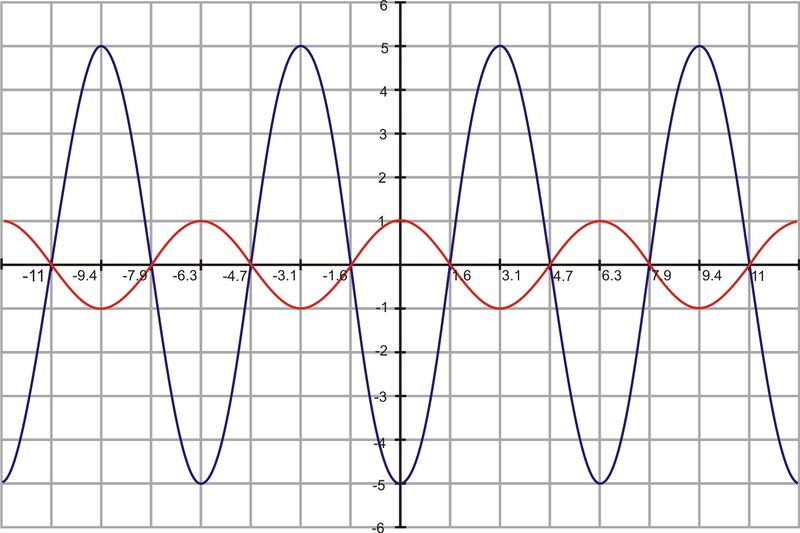
::例1Earlier, you were asked to find the amplitude of the graph.
::早些时候,有人要求你找到图的振幅。Since you now know what the amplitude of a graph is and how to read it, it is straightforward to see from this graph of the sound wave the distance that the wave rises or falls at different times. For this graph, the amplitude is 7.
::既然你现在知道一个图形的振幅和如何阅读它,那么从这个声音波的图中可以看到波在不同时间上升或跌落的距离就直截了当了。对于这个图来说,振幅是7。Example 2
::例2Identify the minimum and maximum values of .
::确定y=cosx的最小值和最大值。The cosine function ranges from -1 to 1, therefore the minimum is -1 and the maximum is 1.
::余弦函数介于-1至1之间,因此最小值为-1,最大值为1。Example 3
::例3Identify the minimum and maximum values of
::确定y=2sinx的最小值和最大值The sine function ranges from -1 to 1, and since there is a two multiplied by the function, the minimum is -2 and the maximum is 2.
::正弦函数介于-1至1之间,由于函数乘以2倍,最低值为-2,最高值为2。Example 4
::例4Identify the minimum and maximum values of
::确定ysinx的最小值和最大值The sine function ranges between -1 and 1, so the minimum is -1 and the maximum is 1.
::正弦函数范围介于-1和1之间,所以最小值为-1,最大值为1。Review
::回顾Determine the amplitude of each function.
::确定每个函数的振幅。-
::y=3sin(x) -
::y2cos(x) -
::y=3+2sin(x) -
::y1+23sin(x) -
::y4+cos( 3x)
Graph each function.
::每个函数图示 。-
::y=4sin(x) -
::ycos(x) -
::y=12sin(x) -
::y y34sin (x) -
::y=2cos(x)
Identify the minimum and maximum values of each function.
::确定每个函数的最小值和最大值。-
::y=5sin(x) -
::ycos(x) -
::y=1+2sin(x) -
::y3+23sin(x) -
::y=2+2cos(x) -
How does changing the constant
change the graph of
?
::如何改变恒定 k 改变 y=ktan(x) 的图形 ? -
How does changing the constant
change the graph of
?
::如何改变恒定 k 改变 y=ksec(x) 的图形 ?
Review (Answers)
::回顾(答复)Click to see the answer key or go to the Table of Contents and click on the Answer Key under the 'Other Versions' option.
::单击可查看答题键, 或转到目录中, 单击“ 其他版本” 选项下的答题键 。 -