3.11 线性不平等的绘图系统
章节大纲
-
Ms. Walochek assigns the following system of linear inequalities for homework. She asks her students to find which quadrant(s) the solution lies in.
::Walochek女士为家庭作业分配了以下线性不平等制度,她请学生们找出解决办法的方块。
::x0y112x-3y < 2Caren says the solution falls only in the first quadrant . Bahir says it falls in all four quadrants . Who is correct?
::Caren说解决方案只落到第一个象限。Bahir说它落到所有四个象限。谁是正确的?Graphing Systems of Linear Inequalities
::线性不平等绘图系统In this section we will be graphing two and three linear inequalities on the same grid and identifying where the shaded regions overlap. This overlapping region is the solution to the system. Note: If the shaded regions do not overlap, there is no solution.
::在本节中,我们将用图表绘制同一网格上的2和3个线性不平等,并确定阴影区域重叠之处。这个重叠区域是系统的解决办法。注意:如果阴影区域不重叠,就没有解决办法。Graph and identify the solutions to the following system.
::绘制图表并确定以下系统的解决方案。
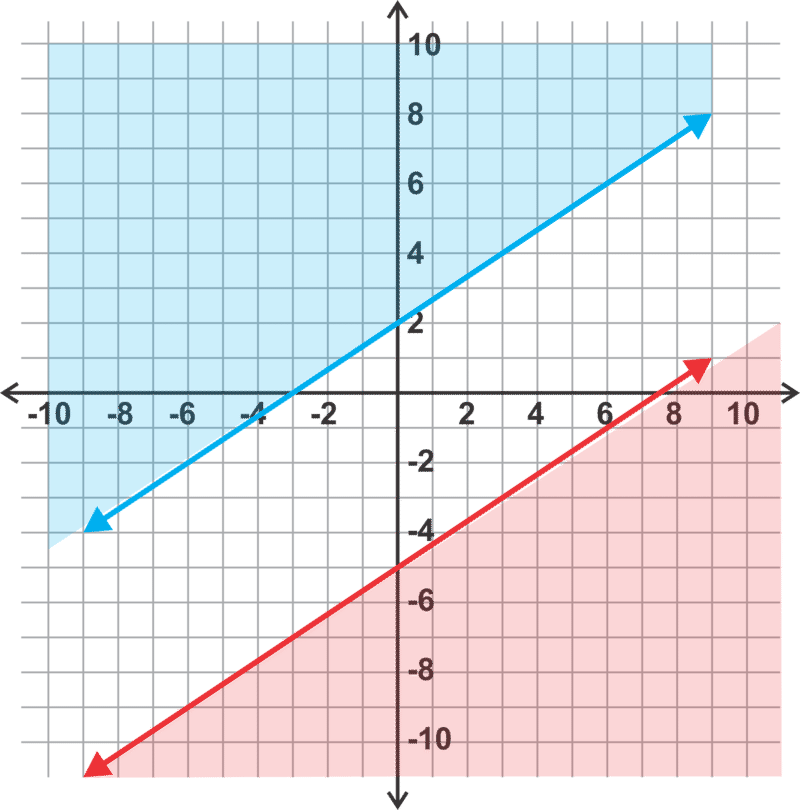
::y2x - 3y4x+1Since both of these inequalities are given in intercept form , we can use the intercept and the slope to graph the lines. Since inequality 1 has “ ”, we will make a dashed line to indicate that the line is not included in the solution and shade above the line where is “greater” (where the axis is above) the line. Since inequality 2 has “ ” we will make a solid line to indicate that the line is included in the solution set and shade below the line where is “less than” (where the axis is below) the line. Inequality 1 is graphed in blue and inequality 2 is graphed in red . The overlap of the shaded regions ( purple shading) represents the solution.
::由于这两种不平等都以截取形式出现,我们可以使用y-截取和斜坡来绘制线条。由于不平等1是“y>”,我们将用一条破折线来表示该线没有包括在y的“更大”线以上(y-axis高于y-axis)线上方的解决方案和阴影。由于不平等2是“y-axis”线,我们将用一条坚固的线来表示该线包括在Y“低于”线线(y-axis低于y-axis低于y-axis)线下方的解决方案和阴影。不平等1以蓝色为图解,不平等2以红色为图解。阴影区域(彩色阴影)的重叠代表了解决方案。Graph and identify the solutions to the following system.
::绘制图表并确定以下系统的解决方案。
::y 23x+2y\\\\\\\\\\\\\\\\\\\\\\\\\\\\\\\\\\\\\\\\\\\\\\\\\\\\\\\\\\\\\\\\\\\\\\\\\\\\\\\\\\\\\\\\\\\\\\\\\\\\\\\\\\\\\\\\\\\\\\\\\\\\\\\\\\\\\\\\\\\\\\\\\\\\\\\\\\\\\\\\\\\\\\\\\\\\\\\\\\\\\\\\\\\\\\\\\\\\\\\\\\\\\\\\\\\\\\\\\\\\\\\\\\\\\\\\\\\\\\\\\\\\\\\\\\\\\\\\\\\\\\\\\\\\\\\\\\\\\\\\\\\\\\\\\\\\\\\\\\\\\\\\\\\\\\\\\\\\\\\\\\\\\\\\\\\\\\\\\\\\\\\\\\\\\\\\\\\\\\\\\\\\\\\\\\\\\\\\\\\\\\\\\\\\\\\\\\\\\\\\\\\\\\\\\\\\\\\\\\\\\\\\\\\\\\\\\\\\\\\\\\\\\\\\\\\\\\\\\\\\\\\\\\\\\\\\\\\\\\\\\\\\\\\\\\\\\\\\\\\\\\Since inequality 1 has “ ”, we will make a solid line to indicate that the line is included in the solution and shade above the line where is “greater” (where the axis is above) the line. Since inequality 2 has “ ” we will make a dashed line to indicate that the line is not included in the solution set and shade below the line where is “less than” (where the axis is below) the line. Inequality 1 is graphed in blue and inequality 2 is graphed in red . In this case the regions do not overlap. This indicates that there is no solution to the system.
::由于不平等1为“y”,我们将用一条坚固的线表示该线包含在“y-axis以上”的界线上方的解决方案和阴影中;由于不平等2为“y”,我们将用一条破线表示该线没有包含在“y-axis以下”“y-axis以下”线下方的解决方案和阴影中;不平等1以蓝色为图解,不平等2以红色为图解;在这种情况下,区域不重叠,这表明系统没有解决办法。Graph and identify the solutions to the following system.
::绘制图表并确定以下系统的解决方案。
::3x-y < 68x+5y40This time, let’s use a different graphing technique. We can identify the intercepts for each equation and graph the lines using these points:
::这一次,让我们使用不同的图形绘制技术。 我们可以识别每个方程式的截取量, 用这些点绘制线条 :For , the intercepts are (2, 0) and (0, -6).
::3x-y<6,拦截次数为(2,0)和(0,6)。For , the intercepts are (5, 0) and (0, 8).
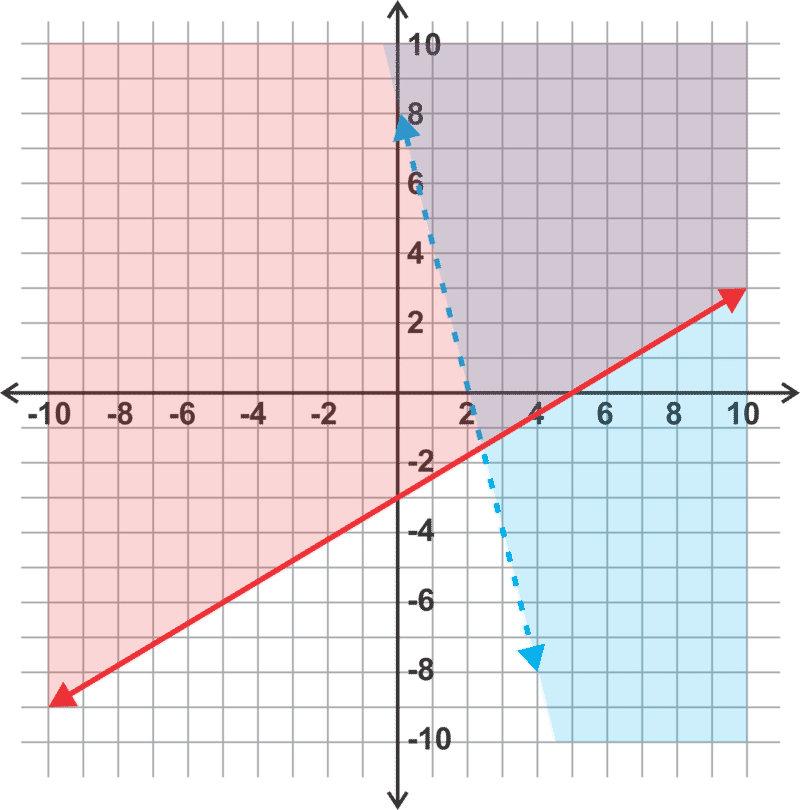
::8x+5y40的拦截次数分别为5、0和0、8。For the first inequality, the symbol is < so the line is dashed. Now, use a test point to determine which way to shade. (0, 0) is an easy point to test. Since this is a true statement, (0, 0) is a solution to the inequality and we can shade on the side of the line with (0, 0).
::对于第一个不平等点,符号是 < 以便线条被冲破。 现在, 使用一个测试点来确定向阴影点的方向 。 (0, 0) 是一个容易测试的点 。 @ 3( 0) - (0) < 6 因为这是一个真实的语句, (0, 0) 是解决不平等的解决方案, 我们可以用 0 阴影在线边 。For the second inequality, the symbol is so the line is solid. Using the same test point, This is a true statement so (0, 0) is a solution to the inequality and we can shade on the side of the line with (0, 0).
::对于第二个不平等,符号是 ,这样线线是固态的。使用相同的测试点, (0,0) 8(0) +5(0) 40 这是真实的语句, 所以(0,0) 是不平等的解决方案, 我们可以用 0, 0来遮蔽线的侧面 。Again, Inequality 1 is graphed in blue and inequality 2 is graphed in red . The overlap of the shaded regions ( purple shading) represents the solution.
::同样,不平等1以蓝色为图表,不平等2以红色为图表。 阴影地区(净阴影)的重叠代表了解决方案。Now, let's graph the following system of linear inequalities:
::现在,让我们来说明以下线性不平等的体系:
::y 23x+3y1x4W e will graph the lines and determine whether each line should be dashed or solid and which way to shade.
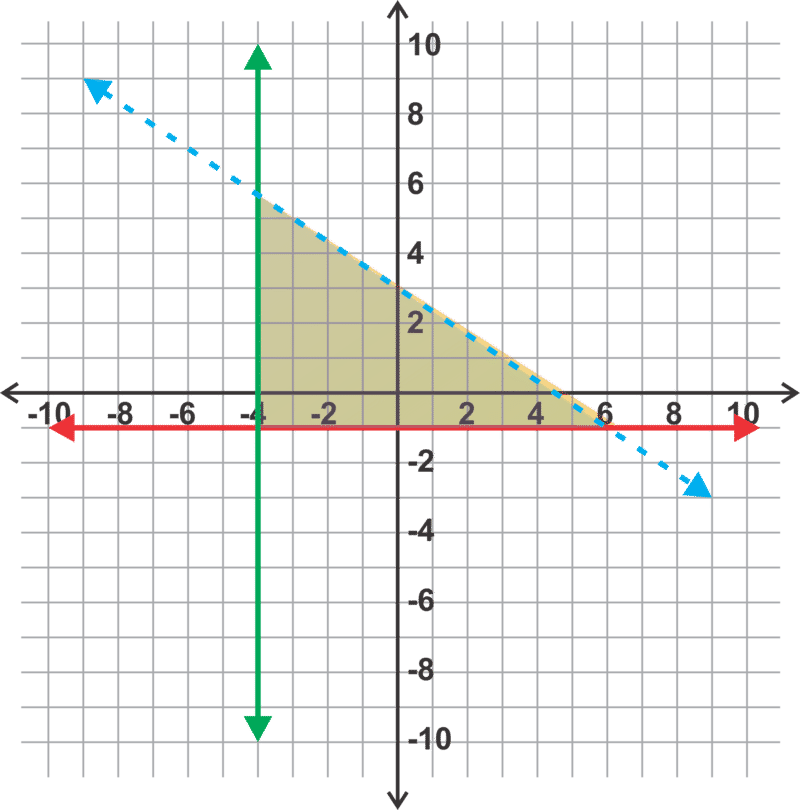
::我们将绘制线条图,确定每一条线是划破的还是固化的,以及哪条线通往阴影。This inequality has a intercept of 3 and slope of . Since the inequality is <, we will shade below the dashed blue line.
::y&23x+3+__________BAR___BAR__BAR__BAR__BAR_BAR_BAR_BAR_BAR_BAR_BAR_BAR_BAR_BAR_BAR_BAR_BAR_BAR_BAR_BAR_BAR_BAR_BAR_BAR_BAR_BAR_BAR_BAR_BAR_BAR_BAR_BAR_BAR_BAR_BAR_BAR_BAR_BAR_BAR_BAR_BAR_BAR_BAR_BAR_BAR_BAR_BAR_BAR_BAR_BAR_BAR_BAR_BAR_BAR_BAR_BAR_BAR_BAR_BAR_BAR_BAR_BAR_BAR_BAR_BAR_BAR_BAR_BAR_BAR________________________________________________________________________________________________________________This is a horizontal line through (0, 1). The line will be solid and we shade above the red line.
::y1This is a vertical line through (-4, 0). The line will be solid and we will shade ( yellow ) to the right of the green line.
::这是一条垂直直线, 穿过( 4, 0) 。 这条直线将是固态的, 我们将向绿线右面( 黄) 阴影( 黄) 。The solution to this system is the shaded region (triangular) in the center where all three shaded regions overlap. This region can be difficult to see in a graph so it is common practice to erase the shading that is not a part of the solution to make the solution region is more obvious.
::该系统的解决方案是位于所有三个阴影区域重叠的中心的阴暗区域(三角形) 。 这个区域可能很难在图表中看到,因此消除阴影是常见的做法,而消除阴影并不是使解决区域成为解决方案的一部分,这一点就更加明显了。Examples
::实例Example 1
::例1Earlier, you were asked who was correct in their answer to which quadrant(s) the solution falls within.
::早些时候,有人问道,谁在回答中是正确的,解决办法属于哪个象限。If we graph all three inequalities on the same grid, we find that most of the overlapping area falls in the first quadrant, but a tiny bit of it also falls in the fourth quadrant. Therefore , neither Caren nor Bahir is correct.
::如果我们用图表显示同一网格上的所有三种不平等,我们就会发现大部分重叠区域位于第一个象限,但其中一小部分也位于第四个象限。 因此,Caren和Bahir都不正确。In each of the solutions below, the first inequality in the system is shown in blue and the second inequality is shown in red . The solution set is the overlapping shaded region in purple . When there are three inequalities, only the solution region is shown to eliminate confusion.
::在以下每种解决方案中,系统中的第一种不平等以蓝色显示,第二种不平等以红色显示。 设定的解决方案是重叠的紫色阴影区域。 当存在三种不平等时,只有解决方案区域可以消除混乱。Example 2
::例2Graph and identify the solutions to the following system.
::绘制图表并确定以下系统的解决方案。
::y=13x+5y>54x-2The inequalities in this system are both already in slope intercept form so we can graph them using the slope and intercept of each line and shade as shown below.
::这一系统中的不平等已经以斜坡截击形式存在,因此我们可以使用斜坡和以下各行和阴影的y-截断来绘制图示。solid line and shade below
::y = 13x+5 + + + + + + + + + + + + + + + + + + + + + + + + + + + + + + + + + + + + + + + + + + + + + + + + + + + + + + + + + + + + + + + + + + + + + + + ++ + + + + + + + ++ + ++ ++ ++ ++++ +++++++++++ ++++++++++++++++++++++++++++++ 下 固线和 下dashed line and shade above
::y>54x-2+++++++++++++++++++++++++++++++++++++++++++++++++++++++++++++++++++++++++++++++++++++++++++++++++++++++++++++++++++++++++++++++++++++++++++++++++++++++++++++++++++++++++++++++++++++++++++++++++++++++++++++++++++++++++++++++++++++++++++++++++++++++++++++++++++++++++++++++++++++++++++++++++++++++++++++++++++++++++++++++++++++++++++++++++++++++++++++++++++++++++++++++++++++++++++++++++++++++++++++++++++++++++++++++++++++++++++++++++++++++++++++++++++++++++++++++++++++++++++++++++++++++++++++++++++++++Example 3
::例3Graph and identify the solutions to the following system.
::绘制图表并确定以下系统的解决方案。
::4x+y>83x-5y}15In these inequalities it is easiest to graph using the and intercepts. Once we have graphed the lines we can use a test point to determine which side should be shaded.
::在这些不平等中,使用 x 和 y 拦截来图解最容易。 一旦我们绘制了线条图,我们就可以使用一个测试点来确定哪一边应该被遮蔽。The intercepts are (2, 0) and (0, 8) and the line will be dashed. If we test the point (0, 0), the inequality is not true so we shade on the side of the line that does not contain (0, 0).
::4x+y>8 拦截为 (2, 0) 和 (0, 8) , 线条会被折断 。 如果我们测试点( 0, 0) , 不平等是不真实的, 所以在不包含线条的侧面阴影( 0, 0) 。The intercepts are (5, 0) and (0, -3) and the line will be solid. The test point (0, 0) satisfies the inequality so we shade on the side of the line that includes (0, 0).
::3x- 5y15 拦截为( 5, 0) 和 (0, 3) , 线条是固态的。 测试点 (0, 0) 满足了不平等性, 所以我们在包括( 0, 0) 的线条的侧面遮蔽 。Example 4
::例4Graph and identify the solutions to the following system.
::绘制图表并确定以下系统的解决方案。
::7x+2y 143x-9y18Again, it is easiest here to graph using the and intercepts. Once we have graphed the lines we can use a test point to determine which side should be shaded.
::同样,在这里使用 x 和 y 拦截来绘制图也是最容易的。 一旦我们绘制了线条图, 我们就可以使用一个测试点来确定哪一边应该被遮蔽 。The intercepts are (2, 0) and (0, 7) and the line will be solid. If we test the point (0, 0), the inequality is true so we shade on the side of the line that contains (0, 0).
::7x+2y14 拦截为(2, 0)和( 0, 7) , 线条将是固态的 。 如果我们测试点( 0, 0) , 不平等是真实的, 因此我们在包含线条( 0, 0) 的侧面阴影 。The intercepts are (6, 0) and (0, -2) and the line will be solid. The test point (0, 0) does not satisfy the inequality so we shade on the side of the line that does not include (0, 0).
::3x- 9y18 拦截是 (6, 0) 和 (0, 2) , 线条将是固态的 。 测试点 (0, 0) 无法满足不平等性, 所以我们在不包含 (0, 0) 的线条的侧面阴影 。Example 5
::例5Graph and identify the solutions to the following system.
::绘制图表并确定以下系统的解决方案。
::y=2x-32x+y=8y=3Inequality 1 can be graphed using the slope and intercept. This line will be solid and the shading will be above this line.
::不平等 1 可以通过斜坡和 y- intercept 绘制图解。 此线将坚固, 阴影将高于此线 。Inequality 2 can be graphed using intercepts. The line will be dashed and we can use a test point to determine that the shaded region will be above this line.
::不平等 2 可以通过拦截来绘制图解。 线条会被冲破, 我们可以使用一个测试点来确定阴暗区域是否高于线条 。Inequality 3 is a horizontal line. It will be dashed and the shading is above this line.
::不平等 3 是一条水平线。 它会被冲破, 阴影会超过这条线 。The intersection of these three regions is shaded in purple on the graph.
::这三个区域的交叉点在图中以紫色遮蔽。Review
::回顾Graph the following systems of linear inequalities.
::线性不平等制度如下图所示。- .
- .
- .
- .
- .
- .
- .
- .
- .
- .
- .
- .
- .
- .
- .
- .
- .
- .
::yxy xxxxxxxxxxxxxx < 5Review (Answers)
::回顾(答复)Click to see the answer key or go to the Table of Contents and click on the Answer Key under the 'Other Versions' option.
::单击可查看答题键, 或转到目录中, 单击“ 其他版本” 选项下的答题键 。