6.3极图的转变
Section outline
-
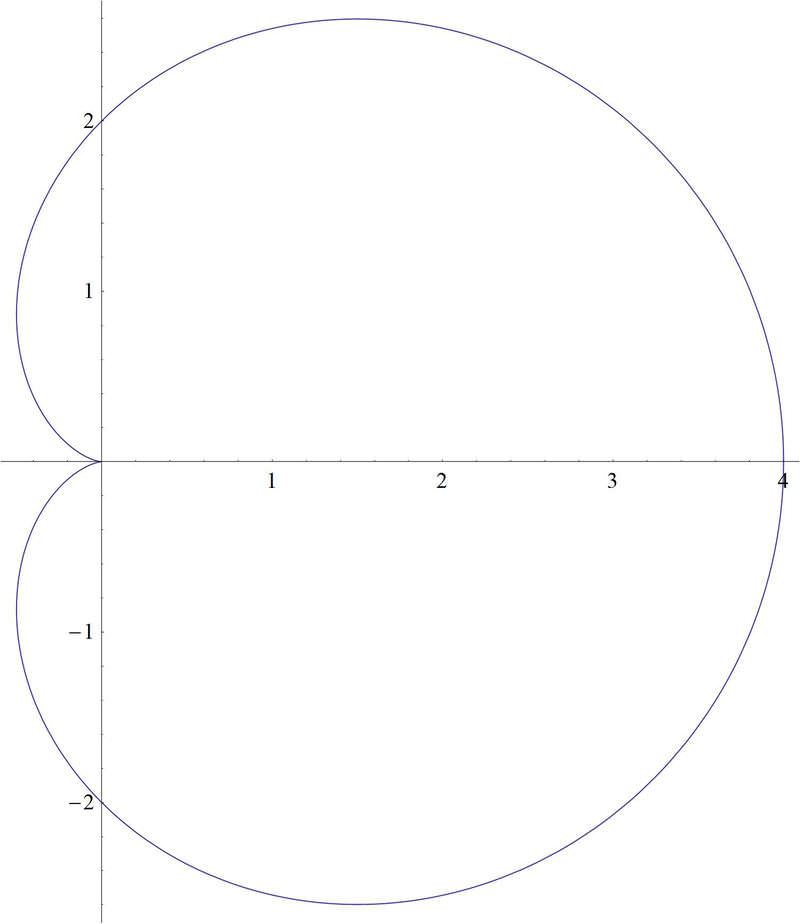
While playing around with your calculator one day, you create a polar plot that looks like this
::有一天你和你的计算器玩耍 制造出一个像这样的极地图Your teacher tells you that this is a polar plot with an equation . You decide you'd like to rotate the graph, so that it is actually on its side, like this
::您的老师告诉您这是一个极地图, 方程 2+2sin。 您决定您想要旋转图形, 这样它实际上在它的侧面, 像这样 。Transforming Polar Graphs
::变换极图Just as in graphing on a rectangular grid, you can also on a polar grid.
::就像在矩形网格上绘制图一样,也可以在极地网格上绘制图。These equations may be simple or complex. To begin, you should try something simple like or where is a constant. The solution for is simply all ordered pairs such that and is any real number. The same is true for the solution of . The ordered pairs will be any real number for and will equal . Here are the graphs for each of these polar equations.
::这些方程式可能是简单或复杂的。 首先, 您应该尝试一些简单的方法, 如 r=k 或 {k} 或 k , k 是常数。 r=1.5 的解决方案只是所有有顺序的对子, 这样 r=1.5 和 {} 是任何实际数字。 对于 {} 30} 的解决方案, 情况也是如此。 订购的对子将是 r 的任何真实数字, r 和 将等于 30}。 以下是这些极方程式的图表 。Graphing Equations
::图形平方1. On a polar plane, graph the equation
::1. 在极平面上,图解方程 r=1.5The solution is all ordered pairs of such that is always 1.5. This means that it doesn’t matter what is, so the graph is a circle with radius 1.5 and centered at the origin.
::答案是所有有顺序的一对(r, ) , r 总是1.5。 这意味着它并不重要 。 因此, 图形是一个半径1.5 的圆形, 以原点为中心 。2. On a polar plane, graph the equation
::2. 在极地平面上,请用图解方程式______________________________________________________________________________________________________________________________________________________________________________________________________________________________________________________________________________________________________________________________________________________________________________________________________________________________________________________________________________________________________________________________________________For this problem, the value, or radius, is arbitrary. must equal , so the result is a straight line, with an angle of elevation of .
::对于这个问题, r 值或半径是任意的 。 必须等于 30 , 所以结果是一个直线, 高度角为 30 。To begin graphing more complicated polar equations, we will make a table of values for or in this case . When the table has been completed, the graph will be drawn on a polar plane by using the coordinates .
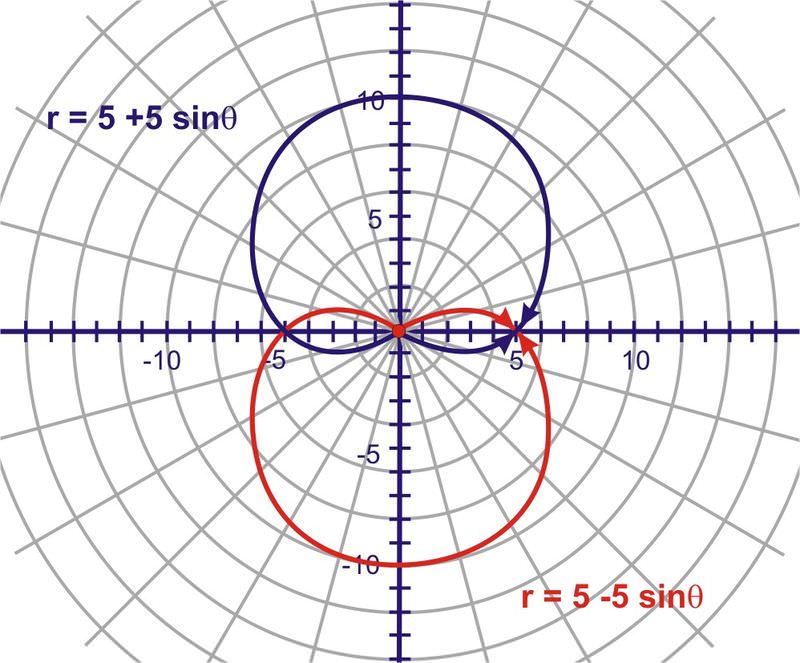
::要开始绘制更复杂的极方公式, 我们将为 y=sin 或在此情况下 r=sin 绘制一个数值表。 当表格完成后, 图形将使用坐标( r, r, ) 在极平面上绘制 。3. Graph the following polar equations on the same polar grid and compare the graphs.
::3. 在同一极网格上绘制以下极方程图,并比较图表。
::r=5+5sinr=5-5sinr=5(1+sin)r=5(1-sin)The cardioid is symmetrical about the positive axis and the point of indentation is at the pole. The result of changing + to - is a reflection in the axis. The cardioid is symmetrical about the negative axis and the point of indentation is at the pole.
::心形对正 y- 轴对称, 缩进点在极上。 将 + 转换为- 是 X- 轴的反射。 心形对称为负 y- 轴, 缩进点在极上 。Changing the value of to a negative did not change the graph of the cardioid.
::将 a 值改为负值时,没有改变心血管图。It is also possible to create a sinusoidal curve called a limaçon. It has or as its polar equation. Not all limaçons have the inner loop as a part of the shape. Some may curve to a point, have a simple indentation (known as a dimple) or curve outward. The shape of the limaçon depends upon the ratio of where is a constant and is the coefficient of the trigonometric function .
::也可以创建一个叫做 limaçon 的正弦曲线。 它有 r = bsin 或 r = a bcos 作为其极方程。 不是所有的 rimaçons 都把内环作为形状的一部分。 一些人可能会曲线到一个点, 有简单的缩进( 被称为小便) 或向外曲线。 limaçon 的形状取决于 ab 的比重, 其中 a 是常数, b 是三角函数的系数 。As we've seen with cardioids, it is possible to create transformations of graphs of limaçons by changing values of constants in the equation of the shape.
::正如我们从心血管中看到的那样, 通过改变形状方程中常数的值, 有可能改变里玛松的图形。Examples
::实例Example 1
::例1Earlier, you were asked to graph a polar equation.
::早些时候,你被要求绘制极方方程图。As you've seen in this section, transformations to the graph of a cardioid can be accomplished by 2 different ways. In this case, you want to rotate the graph so that it is around the "x" axis instead of the "y" axis. To accomplish this, you change the function from a sine function to a cosine function:
::正如您在本节中所看到的那样, 向心类图的转换可以通过两种不同的方式完成。 在这种情况下, 您想要旋转图形, 使其围绕“ x” 轴而不是“ Y” 轴。 要完成此任务, 您将把函数从正弦函数转换为连弦函数 :
::r=2+2cosExample 2
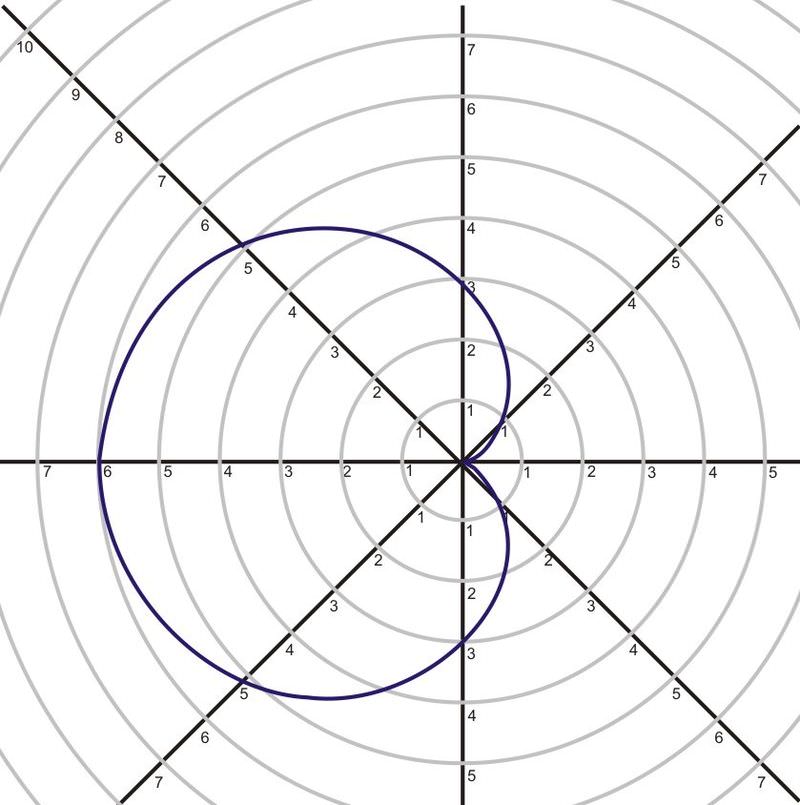
::例2Graph the curve
::曲线图 r3-3cos.
::r3 -3cos。Example 3
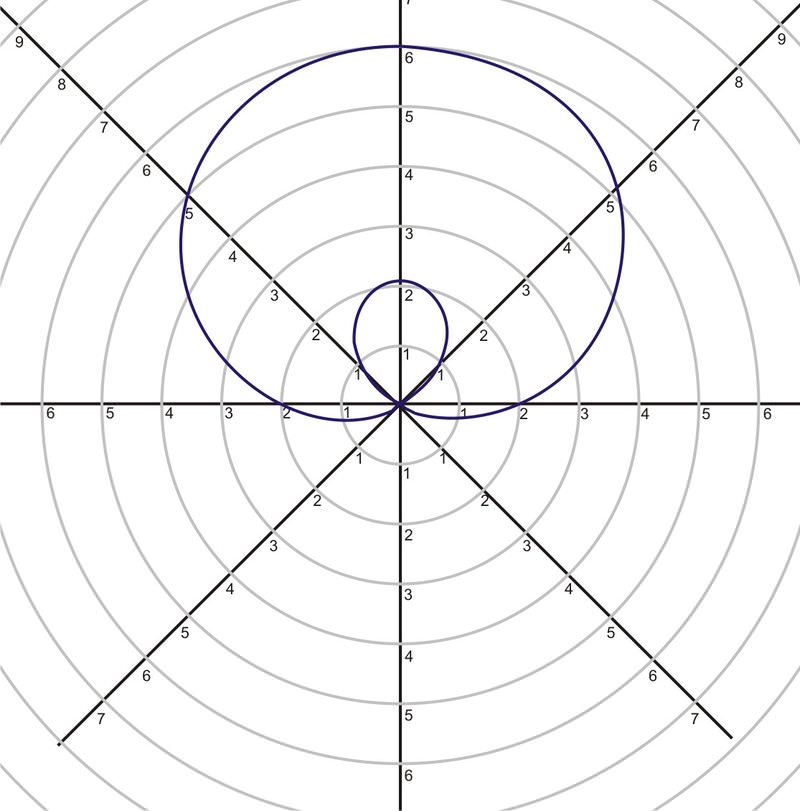
::例3Graph the curve
::曲线 r= 2+4sin 的图解 r= 2+4sin
::r=2+4sinExample 4
::例4Graph the curve
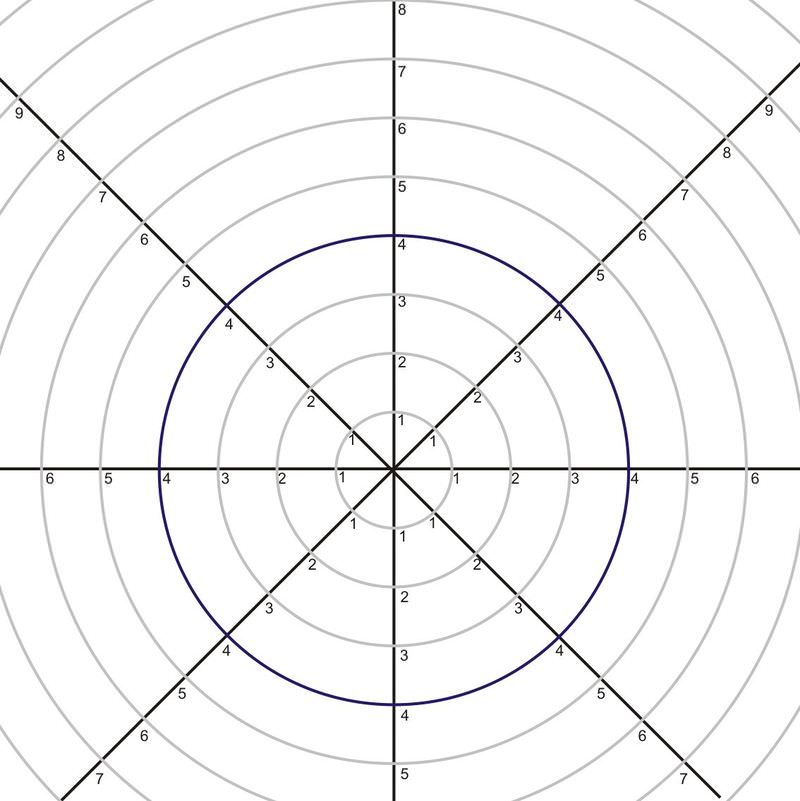
::图解曲线 r=4
::rm=4Review
::回顾Graph each equation.
::分析每个方程。-
::rm=4 -
::r=2
Graph each function using your calculator and sketch on your paper.
::使用您的计算器和纸上的草图来绘制每个函数的图形 。-
::r=3+3sin -
::r=2+4sin___________________________________________________________ -
::r=1 - 5sin -
::r=2-2-2sin(__) -
::r=3+6sin -
::r 3+6sin -
Analyze the connections between the equations and their graphs above. Make a hypothesis about how to graph
for positive or negative values of a and b where
.
::分析方程式与上方图形的关联。 假设 r= a+bsin的正值或负值 。
Graph each function using your calculator and sketch on your paper.
::使用您的计算器和纸上的草图来绘制每个函数的图形 。-
::r=3+3cos -
::r=2+4cos____________________________________________________________________________________ -
::r=1 - 5cos -
::r=2-2-2cos() -
::r=3+6cos -
::r3+6cos(_______________________________________________________________________________________________________________________________________________________________________________________________________________________________________________________________________________________________________________________________________________________________________________________________________________________ -
Analyze the connections between the equations and their graphs above. Make a hypothesis about how to graph
for positive or negative values of a and b where
.
::分析方程式与上方图形之间的联系。 假设如何用 r=a+bcos
Review (Answers)
::回顾(答复)Click to see the answer key or go to the Table of Contents and click on the Answer Key under the 'Other Versions' option.
::单击可查看答题键, 或转到目录中, 单击“ 其他版本” 选项下的答题键 。look for section 6.3.
::见第6.3节。 -