1.10 线性和绝对价值功能家庭
章节大纲
-
On Tuesday, Mr. Varner's math class filed into the room, and gawked at the message on the whiteboard: "The first student to add together all of the numbers between 1 and 100 wins four free movie tickets to the theater next Friday!" Everyone grabbed a pencil and started adding: 1 + 2 + 3 + 4 + 5... No one was further than about 20 when Brian walked in, late as usual, looked at the white board for about 15 secs, and wrote: "5050" on the bottom. The surprised Mr. Varner handed Brian the tickets and told him to take his seat.
::星期二,Varner先生的数学课进入会议室,对白板上的信息表态:“第一个将所有数字加在一起的学生在1到100之间赢得下个星期五的四张免费电影票!”每个人都拿起一支铅笔,开始补充:1+2+3+4+5......当Brian像往常一样迟到一步,看着白板大约15秒,在底部写着“50秒”。Varner先生把票交给Brian,并告诉他坐下来,他很惊讶。How did he come up with the answer so fast?
::他怎么这么快就找到答案了?Linear and Absolute Value Function Families
::线性和绝对价值函数家庭In this Concept we will examine several families of functions. A family of functions is a set of functions whose equations have a similar form. The parent of the family is the equation in the family with the simplest form. For example, y = x 2 is a parent to other functions, such as y = 2 x 2 - 5 x + 3.
::在这个概念中,我们将检查几个功能家庭。功能家庭是一系列功能,其等式具有相似的形式。家庭的父母是家庭中最简单形式的等式。例如,y = x2是诸如y = 2x2 - 5x + 3等其他功能的父母。Linear Function Family
::线性函数家族An equation is a member of the linear function family if it contains no powers of greater than 1. For example, and are linear equations, while and are non-linear.
::等式是线性函数组的成员,如果它不含大于1的x功率的话。 例如,y=2x和y=2是线性方程,而y=x2和y=1x是非线性方程。Linear equations are called linear because their graphs form straight lines. As you may recall from your earlier studies of algebra, we can describe any line by its average rate of change , or , and its y - intercept . (In fact, it is the constant slope of a line that makes it a line!) These aspects of a line are easiest to identify if the equation of the line is written in slope-intercept form , or y = mx + b . The slope of the line is equal to the coefficient m , and the y -intercept of the line is the point (0, b).
::线性方程式被称为线性方程式, 因为它们的图形形成直线线。 正如您从先前的代数研究中可能记得的, 我们可以用任何线条的平均变化率来描述, 或者, 以及它的 Y 界面。 (事实上, 线条的常态斜度使它成为线性! ) 线条的这些方面最容易确定线条的方程是用斜度- interphy 形式还是 y = mx + b 。 线条的斜度等于系数 m , 而线条的 y 界面是点 ( 0, b )。Note that a line can be a member of a family such as the family of "linear functions", and also a member of a sub-family of with the same slope. The graphs of this subfamily will be a set of parallel lines. One particular subfamily of linear functions is the constant function subfamily. The line x = 5 is a constant function, as the function values are constant, or unchanging. The constant functions “sub-family” of linear functions is composed of functions whose graphs are horizontal lines.
::请注意, 线条可以是“ 线性函数” 等家庭的成员, 也可以是具有同一斜度的子家庭的成员。 此子家庭的图形将是一组平行的线性线性线性线性线性线性线性线性函数。 线性函数的一个特定子家庭是常数子家庭。 线性函数 x = 5 是一个恒定的函数, 因为函数值是恒定的, 或者不变的。 线性函数的常数“ 子家庭” 由图形是水平线性的函数组成。Absolute Value Function Family
::绝对价值函数家庭Let’s first consider the parent of the family: y = | x |. Because the absolute value of a number is that number’s distance from zero, all of the function values of an absolute value function will be non-negative. If x = 0, then y = |0| = 0. If x is positive, then the function value is equal to x. For example, the graph contains the points (1, 1), (2, 2), (3, 3), etc. However, when x is negative, the function value will be the opposite of the number. For example, the graph contains the points (-1, 1), (-2, 2), (-3, 3), etc. As you can see in the graph below, the absolute value function forms a “V” shape.
::让我们首先考虑家庭的父母: y = {x} 。 因为数字的绝对值是数字与零的距离, 绝对值函数的所有函数值将是非负值。 如果 x = 0, 那么 y = = 0 = 0。 如果 x 是正值, 那么函数值等于 x。 例如, 图中包含点(1, 1, 2, 2, 2, 3, 3 等 。 但是, 当 x 是负值时, 函数值将会与数字相反 。 例如, 图中包含点( 1, 1, ( 2, 2), ( 3, 3) 等。 如下图所示, 绝对值函数构成“ V” 形状 。There are two important things to note about the graph of this kind of function. First, the absolute value graph has a vertex (a highest or lowest point) and a line of (a line that splits the function into equal and opposite 'halves'). For example, the graph of y = | x | has its vertex at (0, 0) and it is symmetric across the y -axis. Second, note that the graph is not curved, but composed of two straight portions. Every absolute value graph will take this shape, as long as the expression inside the absolute value is linear.
::此函数的图形有两个要注意的重要事项。 首先, 绝对值图形有一个顶点( 最高或最低点) 和一行( 一条将函数分割成等反“ halves ” 的线条) 。 例如, y = = x 的图形在 0, 0) 时有其顶点, 并且横跨 y 轴。 其次, 注意该图形没有曲线, 由两个直线部分组成。 每个绝对值图形都将以此形状显示, 只要绝对值中的表达是线性 。Piece-Wise Defined Functions
::PhileWise 定义函数Consider again the function y = | x |. For positive x values, the graph resembles the identity function y = x . For negative x values, the graph resembles the function y = - x . We can express this relationship by defining the absolute value function in two pieces:
::再次考虑函数 y = {{{{{{{}}} 。对于正 x 值,图形类似于身份函数 y = x。对于负 x 值,图形类似于函数 y = -x。我们可以用两个字来定义绝对值函数:
:xx)xxxxx,x<0x,x=0)
We can read this notation as: the function values are equal to - x if x is negative. The function values are equal to x if x is 0 or positive.
::我们可以读取此符号 : 函数值等于 - x, 如果 x 是负值。 如果 x 0 或正值, 函数值等于 x 。A piece-wise defined function does not have to represent a function that can already be written as a single equation, such as the absolute value function. For example, one “piece” may be from one function family, while another piece is from a different function family.
::字符串定义的函数不必代表已经可以写成单方程式的函数,例如绝对值函数。例如,一个“件”可能来自一个函数家族,另一个“件”可能来自另一个函数家族。Examples
::实例Example 1
::例1Earlier, you were given a problem about Mr. Varner's math class giveaway.
::之前,你对Varner先生的数学课有意见He wrote the following message on the whiteboard: "The first student to add together all of the numbers between 1 and 100 wins four free movie tickets to the theater next Friday!" Everyone grabbed a pencil and started adding: 1 + 2 + 3 + 4 + 5... No one was further than about 20 when Brian walked in, looked at the white board for about 15 secs, and wrote: "5050" on the bottom. Mr. Varner handed Brian the tickets and told him to take his seat. How did he come up with the answer so fast?
::他在白板上写了以下信息:“第一个把数字加在一起的第一位学生在1到100之间,在下周五赢得了四张免费电影票!” 每个人都拿起一支铅笔,开始添加:1+2+3+3+4+5......当布赖恩走进来时,没有人比20岁多,看着白板大约15秒,写在下面写着:“50秒”。Varner先生把票交给了布赖恩,并告诉他坐下。他怎么这么快就找到答案呢?Brian recognized that he didn't need to add each of the numbers individually, only the pairs: 100 + 0 = 100, so does 99 + 1, and 98 + 2, and so on. Since there are 50 pairs of 100, that adds up to 5000. The only number without a pair is 50, so it gets added to the total: 5050.
::Brian认识到,他不需要单独增加每个数字,只有配对:100+0=100,99+1和98+2等也是如此。由于有50对100,加起来为5000。只有50个没有一对的数字,所以加到总数:5050。represent this same sort of time-saver. By recognizing common bits of information and combining them in different ways, we can 'automate' some very complex-seeming processes.
::通过识别共同的信息比特点并以不同的方式将其合并,我们可以“自动化”一些非常复杂的过程。Example 2
::例2Identify the slope and the y -intercept of each line.
::识别每条线的斜坡和 Y 界面 。-
::y=23x-1
This line has slope (2/3) and the y -intercept is the point (0, -1).
::此线有斜坡( 2/ 3) , y 界面是点( 0, - 1 ) 。-
::y=5 y=5
This is a horizontal line. The slope is 0, and the y -intercept is (0,5).
::这是水平线。 斜坡是 0, y 拦截是 0, 5 。-
::x% 2
This is a vertical line. The slope is undefined , and the line does not cross the y -axis. (Note that this line is not a function!)
::这是一条垂直线。 斜坡没有定义, 且线不会跨 Y 轴 。 (请注意, 此线不是一个函数 ! )-
::y=23x+3 y=23x+3
The slope of this line is 2/3, and the y -intercept is the point (0, 3).
::此线的斜坡是 2/3, y 截取是点 (0, 3) 。Example 3
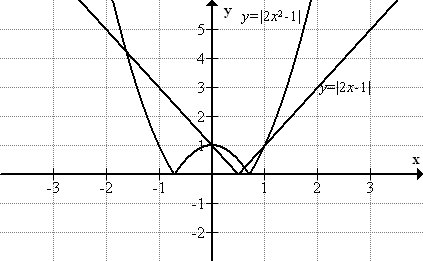
::例3Graph the following: and .
::图如下:y2x-1和y2x2-1。The graph of makes a “V” shape, much like .
::y2x-1 的圖像做了一個「V」形狀, 非常像yx。The function inside the absolute value, 2x+1, is linear, so the graph is composed of straight lines.
::绝对值 2x+1 内的函数为线性,因此图形由直线组成。The graph of is curved, and it does not have a single vertex, but two “cusps.”
::y2x2-1 的图形是曲线, 它没有单一的顶点, 而是两个“ 缓冲 ” 。The function inside the absolute value is NOT linear, therefore the graph contains curves.
::绝对值内的函数不是线性,因此,图形包含曲线。Example 4
::例4Sketch a graph of the function
::绘制函数的图形
::f( x) x2, x < 2x+3, x%2It is important to note that the pieces of a piece-wise defined function may or may not meet up. For example, in the graph of f ( x ) above, the function value is 4 at x = -2, but the piece of the graph that is defined by x + 3 is headed to the y value of 1. Therefore the two pieces do not meet.
::必须指出的是,按片段定义的函数的片段可能相匹配,也可能不相匹配。例如,在上文f(x) 的图表中,函数值为 4 : x = - 2,但由 x + 3 定义的图段正向Y 值1。因此,两部分不相匹配。Example 5
::例5Find the x- intercepts of the function .
::查找函数 f( x) = 8\\\ x- 7\\\\ 64 的 x 界面 。To find the x -intercepts, set f(x) equal to 0 , and solve for x :
::要找到 x 界面, 设置 f( x) 等于 0, 并解决 x :
::0=8x-764
::64=8x-7
::8x-7or
::8=(x-7) or8 (x-7)or
::15=x或-1=xthe x -intercepts are 15 and -1
::X 界面是 15 和 - 1 。Example 6
::例6What is the graph of ? How is that graph related to the graph of ? What happens to the graph of when the equation changes to ?
::yx 的图形是什么? 该图形与 yxk 的图形有什么关系? 当 yx 的方程式向 yx 5 变化时, yx 的图形会怎么样 ?The graph of is shown below. You can either use a graphing tool, or plot points, noting that every positive x has a matching y , and every negative x matches with its positive equivalent as y . is the simplest example of a graph in the absolute value function family , of which is the parent. Changes to , , and shift the graph of in different ways.
::yx 的图形在下面显示。 您可以使用图形工具或绘图点, 指出每个正 x 都有匹配 y, 而每负 x 与正等值y. yx 是绝对值函数组合中图形最简单的示例, 其中 y=x- hk 是父函数。 更改 a, h, k 以不同方式移动 yx 的图形 。The graph of is below. It is clear that the -5 after the absolute value causes the graph to shift down 5 places.
::yx% 5 的图形在下面。 很明显, 绝对值之后的 - 5 使图形向下移动 5 位 。Review
::回顾For questions 1-5, identify the family that each function belongs to.
::对于问题1-5,确定每个功能所属的家庭。-
::~ ~~~~~~~~~~~~~~~~~~~~~~~~~~~~~~~~~~~~~~~~~~~~~~~~~~~~~~~~~~~~~~~~~~~~~~~~~~~~~~~~~~~~~~~~~~~~~~~~~~~~~~~~~~~~~~~~~~~~~~~~~~~~~~~~~~~~~~~~~~~~~~~~~~~~~~~~~~~~~~~~~~~~~~~~~~~~~~~~~~~~~~~~~~~~~~~~~~~~~~~~~~~~~~~~~~~~~~~~~~~~~~~~~~~~~~~~~~~~~~~~~~~~~~~~~~~~~~~~~~~~~ -
::y=3x- 4 y -
: -
::2=y -
:
-
Graph the following piecewise function by hand:
::用手绘制以下的片段函数图 : f( x) x, x%0- x, x < 0 -
On your graphing calculator, graph the function
, and answer the following questions: a. What is the shape of the graph? b. Compare the graph to the graph in the problem above. What is the difference between the two graphs? c. What is the slope of the two lines that create the graph?
::在您的图形计算计算器上,绘制函数 f(x)\\\\\\\\\\\\\\\\\\\\\\\\\\\\\\\\\\\\\\\\\\\\\\\\\\\\\\\\\\\\\\\\\\\\\\\\\\\\\\\\\\\\\\\\\\\\\\\\\\\\\\\\\\\\\\\\\\\\\\\\\\\\\\\\\\\\\\\\\\\\\\\\\\\\\\\\\\\\\\\\\\\\F\\\\\\\\\\\\\\\\\\\\\\\\\\\\\\\\\\\\\\\\\\\\\\\\\\\\\\\\\\\\\\\\\\\\\\\\\\\\\\\\\\\\\\\\\\\\\\\\\\\\\\\\\\\\\\\\\\\\\\\\\\\\\\\\\\\\\\\\\\\\\\\\\\\\\\\\\\\\\\\\\\\\\\\\\\\\\\\\\\\\\\\\\\\\\\\\\\\\\\\\\\\\\\\\\\\\\\\\\\\\\\\\\\\\\\\\\\\\\\\\\\\\\\\\\\\\\\\\\\\\\\\\\\\\\\\\\\\\\\\\\\\\\\\\\\\\\\\\\\\\\\\\\\\\\\\\\\\\\\\\\\\\\\\\\\\
For each equation that follows, identify the coordinates of the vertex of the graph, without actually graphing.
::对于以下的每一个方程式,请标明图形顶端的坐标,而不必实际绘制图表。-
: -
: -
: -
:
-
The graph of
is shown below. If
, how will the graph of
be different from the graph of
?
::p( x) . -
Graph the absolute value equation, create your own table to justify values:
::图形绝对值方程式, 创建您自己的表格以证明 : f( x)\\\ x- 3 \ \ \ \ \ \ \ \ \ \ \ \ \ \ \ \ \ \ \ \ \ \ \ \ \ \ \ -
Graph the absolute value equation, create your own table to justify values:
::图形绝对值方程式, 创建您自己的表格以证明 : g( x)\\\ x+3 \ \ \ \ \ \ \ \ \ \ \ g( x)\ x+3 \ \ \ \ \ \ \ \ \ \ \ \ \
Identify the parent function for each set of linear functions. Graph each set of functions using a graphing calculator. Identify similarities and differences of each set.
::指定每组线性函数的父函数。 使用图形计算器绘制每组函数的图。 确定每组函数的相似性和差异 。-
a.
, b.
, c.
, d.
,
::a. f(x)=x-7, b. f(x)=x-2, c. f(x)=x+1, d. f(x)=x+5, c. f(x)=x+1, d. f(x)=x+5;
e.
::e. f(x)=x+10Parent Function:
::父函数 :Similarities:
::相似点:Differences:
::差异:-
a.
, b.
, c.
::a. f(x) = 211x, b. f(x) = 12x, c. f(x) = 23x
Parent Function:
::父函数 :Similarities:
::相似点:Differences:
::差异:-
a.
, b.
, c.
, d.
, e.
::a. f(x)=x-7,b. f(x)=2x,c. f(x)=4x,d. f(x)=2x+5,e. f(x)=6x-10
Parent Function:
::父函数 :Similarities:
::相似点:Differences:
::差异:Use the standard form of a linear equation: and your investigations above to help you answer the following questions.
::使用线性方程的标准格式 f( x) = ax+b 和以上调查, 帮助您回答下列问题 。-
How does the a value affect the graph?
::此值如何影响图形 ? -
How does the b value affect the graph?
::b 值如何影响图形 ? -
How are the domain values similar/different?
::域值如何相似/不同? -
How are the range values similar/different?
::范围值如何相似/不同? -
Does the a and/or b value affect the domain?
::a 和/或 b 值是否影响域? -
Does the a and/or b value affect the range?
::a 和/或 b 值是否影响范围?
Review (Answers)
::回顾(答复)Click to see the answer key or go to the Table of Contents and click on the Answer Key under the 'Other Versions' option.
::单击可查看答题键, 或转到目录中, 单击“ 其他版本” 选项下的答题键 。 -