7.4 平方根函数图
章节大纲
-
Mrs. Garcia has assigned her student the function to graph for homework. The next day, she asks her students which quadrant(s) their graph is in.
::Garcia夫人指派她的学生用yx+2-3功能来图表做家庭作业,第二天,她问她的学生他们的图表在哪个象限里。Alendro says that because it is a square root function , it can only have positive values and therefore his graph is only in the first quadrant .
::Alendro说,因为它是一个平方根函数,它只能有正值,因此他的图表只在第一个象限内。Dako says that because of the two negative sign, all y values will be positive and therefore his graph is in the first and second quadrants .
::Dako说,由于两个负的信号,y的所有值都将是正值,因此他的图表在第一和第二四位数中。Marisha says they are both wrong. Because it is a negative square root function, her graph is in the third and fourth quadrants.
::Marisha说两者都是错的。 因为这是一个负平方根函数, 她的图表在第三和第四个四分位数中。Which one of them is correct?
::哪一个是正确的?Graphing Square Root Functions
::图形平方根函数A square root function has the form , where is the parent graph . Graphing the parent graph, we have:
::平方根函数有 y=ax-h+k 的窗体, Y=x 是母图。x y 16 4 9 3 4 2 1 1 0 0 -1 und Notice that this shape is half of a parabola , lying on its side. For , the output is the same as the input of . The domain and range of are all positive real numbers, including zero. cannot be negative because you cannot take the square root of a negative number.
::请注意, 此形状是 parbola 的 半 。 对于 y=x , 输出与 y=x 的输入相同 。 y=x 的域和范围都是正数, 包括 0。 x 不能是负数, 因为不能从负数的平方根中取出正数 。Let's graph without a calculator.
::让我们用图y=x-2+5来显示无计算器的 y=x-2+5 。To graph this function, draw a table. is a critical value because it makes the radical zero.
::要绘制此函数,请绘制表格。 x=2 是一个关键值,因为它使基数为零。x y 2 5 3 6 6 7 11 8 After plotting the points, we see that the shape is exactly the same as the parent graph. It is just shifted up 5 and to the right 2. Therefore, we can conclude that is the horizontal shift and is the vertical shift .
::在绘制了点后, 我们可以看到形状与父图完全相同。 它只是向上移了 5 和向右移了 2 。 因此, 我们可以得出结论, h 是水平转换, k 是垂直转换 。The domain is all real numbers such that and the range is all real numbers such that .
::域名是所有真实数字, 即 x% 2, 范围是所有真实数字, 即 y% 5 。Now's let's graph and find the domain and range.
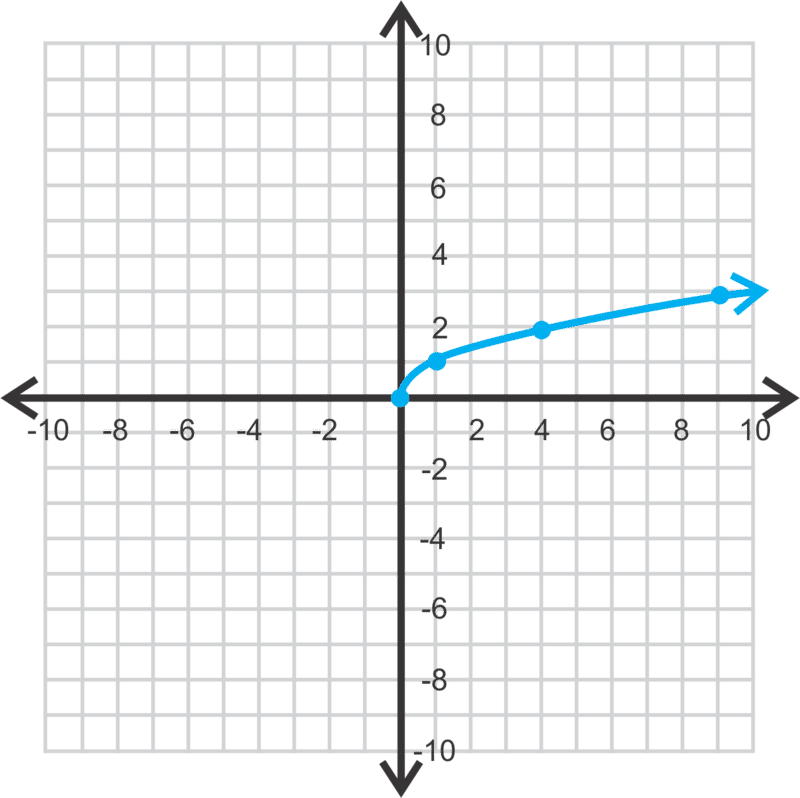
::现在让我们来绘制 y=3x+1 并找到域和范围 。From the previous problem , we already know that there is going to be a horizontal shift to the left one unit. The 3 in front of the radical changes the width of the function. Let’s make a table.
::从上一个问题开始,我们已经知道左侧的单位会横向移动。 3 前面的3 改变函数的宽度。 让我们来做一张表格。x y 0 0 3 3 6 8 9 15 12 Notice that this graph grows much faster than the parent graph. Extracting from the equation , the starting point is and then rather than increase at a “slope” of 1, it is three times larger than that.
::请注意, 此图的生长速度比父图快得多。 从方程式中提取( h, k) 时, 起始点是 (- 1, 0) , 而不是在 1 的“ 斜面” 上增加, 它比该方程式大三倍 。Finally, let's graph .
::最后,让我们用图表f(x)x-2+3。Extracting from the equation, we find that the starting point is . The negative sign in front of the radical indicates a reflection . Let’s make a table. Because the starting point is , we should only pick -values after .
::从方程中提取 (h,k) 时, 我们发现起点是(2, 3) 。 激进分子前面的负符号表示反射。 让我们来做一张表。 因为起点是(2, 3 ) , 我们只能在 x=2 之后选择 x 值 。x y 2 3 3 2 6 1 11 0 18 -1 The negative sign in front of the radical, we now see, results in a reflection over -axis.
::现在我们看到,激进分子面前的负面迹象导致X轴反射。Using the graphing calculator: If you wanted to graph this function using the TI-83 or 84, press and clear out any functions. Then, press the negative sign, (-) and 2nd , which is . Then, type in the rest of the function, so that . Press GRAPH and adjust the window.
::使用图形计算器 : 如果您想要使用 TI- 83 或 84 来图形显示此函数, 请按 Y = 并清除任何函数 。 然后按负符号 (-) 和 2ndx2 , 即 。 然后键入此函数的其余部分, 以便 Y (X-2) +3. 按 GRAPH 键并调整窗口 。Examples
::实例Example 1
::例1Earlier, you were asked to determine which student was correct.
::早些时候,有人要求你确定哪个学生是正确的。If you graph the function , you will see that its domain is , which makes all of the quadrants possibilities. But its range is , limiting the graph to the third and fourth quadrants. Therefore, Marisha is correct.
::如果您将函数 yx+2- 3 图形, 您就会看到它的域是 x2, 这使得所有四重体都有可能。 但范围是 y3 , 将图限制在第三和第四 夸体。 因此, Marisha 是正确的 。Example 2
::例2Evaluate when .
::当 x=9 时评价 y2x- 5+8 。Plug in into the equation and solve for .
::将 x=9 中的插件插在公式和y 的解析中。
::y 29 - 5+8 _ 24+8 _ 2 (2)+8 _ 4+8 _ 4Example 3
::例3Graph, describe the relationship to the parent graph and find the domain and range: .
::图表,描述与父图形的关系,并查找域和范围:yx。Here, the negative is under the radical. This graph is a reflection of the parent graph over the -axis.
::这里的负值在基下。 这个图是 Y 轴上的母图的反射 。The domain is all real numbers less than or equal to zero. The range is all real numbers greater than or equal to zero.
::域名是所有实际数字小于或等于零。范围是所有实际数字大于或等于零。Example 4
::例4Graph, describe the relationship to the parent graph and find the domain and range: .
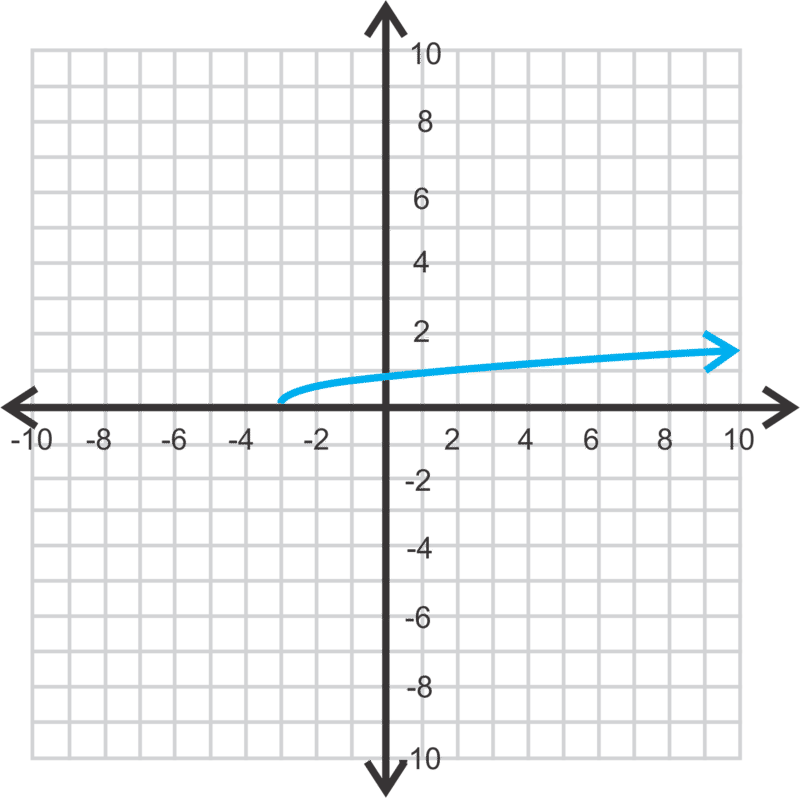
::图表,描述与父图形的关系,并查找域和范围:f(x)=12x+3。The starting point of this function is and it is going to “grow” half as fast as the parent graph.
::此函数的起点是 (- 3,0) , 它的“ 增长” 速度会快于母图的一半 。The domain is all real numbers greater than or equal to -3. The range is all real numbers greater than or equal to zero.
::域是所有实际数字大于或等于-3.。 范围是所有实际数字大于或等于0。Example 5
::例5Graph using a graphing calculator .
::使用图形计算器 f( x)\\% 4x- 5+1 的图形图。Using the graphing calculator, the function should be typed in as: . It will be a reflection over the -axis, have a starting point of and grow four times as fast as the parent graph.
::使用图形计算计算器,函数应输入为:Y4(X-5)+1。它将是X轴的反射,起点为(5,1),生长速度为父图形的四倍。Review
::回顾Evaluate the function, for the following values of x .
::对以下 x 值的 f(x) x-4+3 函数进行评价。-
::f(3) f(3) -
::f(6) f(6) -
::f(13) -
What is the domain of this function?
::此函数的域是什么 ?
Graph the following square root functions and find the domain and range. Use your calculator to check your answers.
::绘制以下平方根函数图并找到域和范围。使用您的计算器来检查答案。-
:xx)=x+2
-
::y=x - 5-2 -
::y2x+1 -
: -
: -
: -
::y=21-x y=21-x -
::y=x+3 - 5 y=x+3 - 5 -
: -
::y32x-3+6 -
::y35 - x+7 y35 - x+7 -
:
Review (Answers)
::回顾(答复)Click to see the answer key or go to the Table of Contents and click on the Answer Key under the 'Other Versions' option.
::单击可查看答题键, 或转到目录中, 单击“ 其他版本” 选项下的答题键 。 -