2.4 使用零的多元体图
章节大纲
-
How is finding and using the zeroes of a higher- degree polynomial related to the same process you have used in the past on quadratic functions?
::如何发现和使用更高度多元度的零与过去用于二次函数的同一过程相关?Graphing Polynomials Using Zeros
::使用零度绘制多面图The following procedure can be followed when graphing a polynomial function .
::在绘制多元函数图时,可遵循以下程序。-
Use the leading-
term
test to determine the end behavior of the graph.
::使用前期测试来确定图形的最终行为 。 -
Find the
intercept(s) of
by setting
and then solving for
.
::通过设置 f( x) =0 来查找 f( x) 的 x- interfits( s) ,然后解析 x 。 -
Find the
intercept
of
by setting
and finding
.
::通过设置 y= f(0) 和查找 y 查找 f(x) 的 y- interview 。 -
Use the
intercept(s) to divide the
axis into intervals and then choose test points to determine the sign of
on each interval.
::使用 x- interfict 来将 x- 轴分隔为间隔, 然后选择测试点来确定每个间隔的 f( x) 符号 。 -
Plot the test points.
::绘制测试点。 -
If necessary, find additional points to determine the general shape of the graph.
::如有必要,请另找点来确定图表的一般形状。
The Leading-Term Test
::A. 前期测试If is the leading term of a polynomial. Then the behavior of the graph as or can be known by one the four following behaviors:
::如果 anxn 是多面性的主要术语。 那么图形的 x 或 x 的行为可以被以下四种行为之一所知道 :1. If and even:
::1. 如果一个 >0和n偶数:2. If and even:
::2. 如果 <0和n 偶数:3. If and odd:
::3. 如果 > 0和n 奇数:4. If and odd:
::4. 如果 <0和n 奇数:Examples
::实例Example 1
::例1Earlier, you were asked to identify some similarities in graphing using zeroes between quadratic functions and higher-degree .
::早些时候,有人要求您在使用四边函数和更高度之间零的图形绘制中找出一些相似之处。Despite the more complex nature of the graphs of higher-degree polynomials, the general process of graphing using zeroes is actually very similar. In both cases, your goal is to locate the points where the graph crosses the x or y axis. In both cases, this is done by setting the y value equal to zero and solving for x to find the x axis intercepts , and setting the x value equal to zero and solving for y to find the y axis intercepts.
::尽管高度多面形图的复杂性质,但使用零进行图形绘制的一般过程实际上是非常相似的。 在这两种情况下,您的目标是确定图形横过 x 或 y 轴的点。 在这两种情况下,这样做的方式是将y 值设定为零,解决 x 以寻找 x 轴拦截,将x 值设定为零,并解决 y 以查找 y 轴拦截。Example 2
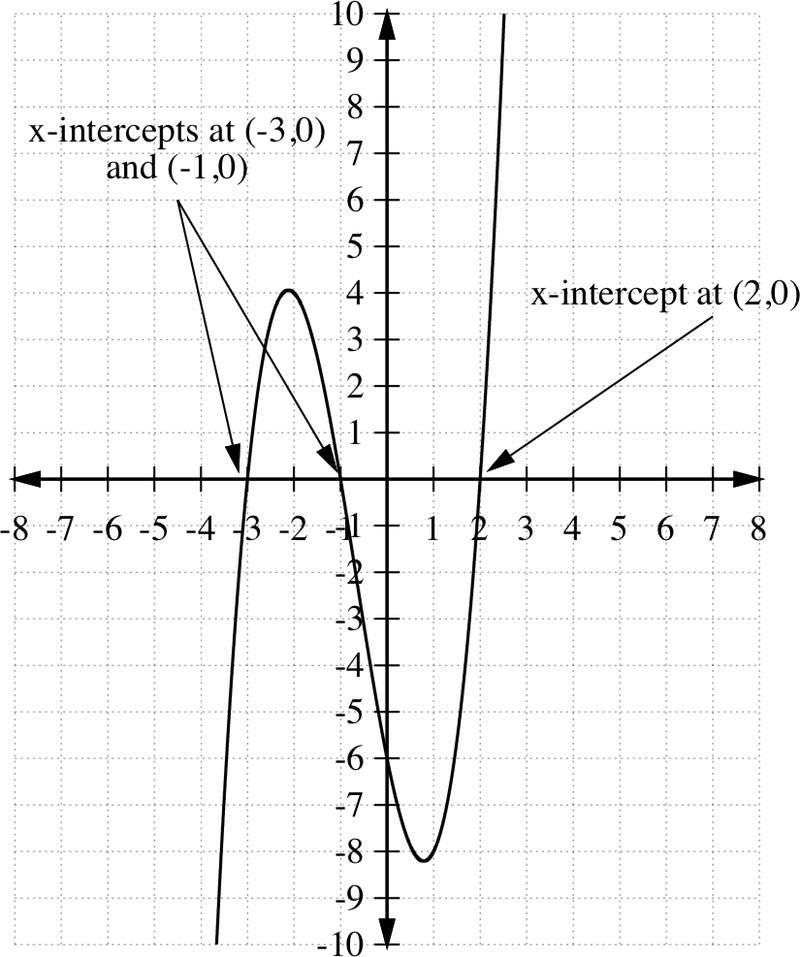
::例2Find the roots (zeroes) of the polynomial:
::查找多元数的根( 零) :
::h(x) =x3+2x2-5x-6Start by factoring:
::以保理因素开始 :
::h(x) =x3+2x2-5x-6=(x+1)(x-2)(x+3)To find the zeros , set h ( x )=0 and solve for x .
::要找到零,请设置 h(x)=0,并解决 x。
:x+1)(x-2)(x+3)=0)
This gives
::此给给
::x+1=0x-2=0x+3=0or
::或
::x1x=2x%3So we say that the solution set is . They are the zeros of the function . The zeros of are the intercepts of the graph below.
::因此,我们说,解决方案是++3, ~1,2}。它们是函数 h(x) 的零。 h(x) 的零是下图 y=h(x) 的 x- interview。Example 3
::例3Find the zeros of .
::查找 g(x) (x- 2) (x-2) (x-2) (x+1) (x+5) (x+5) (x+5) (x+5) 的零。The polynomial can be written as
::多义可被写为
::g(xx)(x-2)、2(x+1)(x+5)3To solve the equation , we simply set it equal to zero
::为了解决方程式,我们只要设定它等于零
::- (x--2)2(x+1)(x+5)3=0this gives
::给此给
::x-2=0x+1=0x+5=0or
::或
::x2=2x%1x%5Notice the occurrence of the zeros in the function. The factor occurred twice (because it was squared), the factor occurred once and the factor occurred three times. We say that the zero we obtain from the factor has a multiplicity and the factor has a multiplicity .
::注意函数中出现零的发生。系数(x-2)发生两次(因为它是正方形),系数(x+1)发生一次,系数(x+5)发生三次。我们说,从系数(x-2)获得的零是mplick=2,系数(x+5)存在mplick=3。Example 4
::例4Graph the polynomial function .
::图解多边函数 f(x)\\\\\\\\\\\\\\\\\\\\\\\\\\\\\\\\\\\\\\\\\\\\\\\\2x3\\\\\\\\\\\\\\\\\\\\\\\\\\\\\\\\\\\\\\\\\\\\\\\\\\\\\\\\\\\\\\\\\\\\\\\\\\\\\\\\\\\\\\\\\\\\\\\\\\\\\\\\\\\\\\\\\\\\\\\\\\\\\\\\\\\\\\\\\\\\\\\\\\\\\\\\\\\\\\\\\\\\\\\\\\\\\\\\\\\\\\\\\\\\\\\\\\\\\\\\\\Since the leading term here is then , and even. Thus the end behavior of the graph as and is that of Box #2, item 2.
::由于这里的首字母是 - 3x4, 然后是 {% 3 < 0 和 n= 4 偶数。 因此, 图表的结尾行为为 x 和 x , 是框2, 第2项的结尾行为 。We can find the zeros of the function by simply setting and then solving for .
::我们只要设置 f(x)=0,就可以找到函数的零,然后解决 x。
::3x4+2x3=0-x3(3x-2)=0This gives
::此给给
::x=0.x=23xx=23So we have two intercepts, at and at , with multiplicity for and multiplicity for .
::因此,我们有两个x- 截取器, 在 x= 0 和 x= 23 上, 多重 k= 3 表示 x= 0 , 多重 k= 1 表示 x= 23 。To find the intercept, we find , which gives
::为了找到y- interintermissuct, 我们找到了 f(0), 它给了
:So the graph passes the axis at .
::因此,图表通过y=0的y-轴。Since the intercepts are 0 and , they divide the axis into three intervals: and . Now we are interested in determining at which intervals the function is negative and at which intervals it is positive. To do so, we construct a table and choose a test value for from each interval and find the corresponding at that value.
::由于 x- intercuts 是 0 和 23, 它们将 x- 轴分为三个间隔Interval Test Value Sign of Location of points on the graph -1 -5 - below the axis + above the axis 1 -1 - below the axis Those test points give us three additional points to plot: , and (1, -1). Now we are ready to plot our graph. We have a total of three intercept points, in addition to the three test points. We also know how the graph is behaving as and . This information is usually enough to make a rough sketch of the graph. If we need additional points, we can simply select more points to complete the graph.
::这些测试点给了我们另外三个可以绘制的点子Example 5
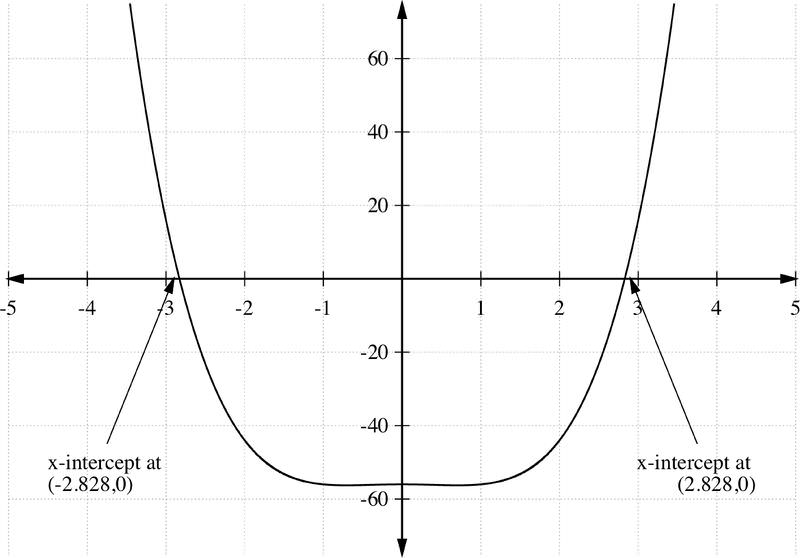
::例5Find the zeros and sketch a graph of the polynomial
::查找零点并绘制一个多面性图
:This is a factorable equation,
::这是一个可考虑因素的方程式,
:Setting ,
::设置 f( x) = 0,
:the first term gives
::第一个学期第一个学期给
::x2 - 8=0x2=8x=8x @ @ @ @ @%8 @% 22and the second term gives
::和第二个任期 给予
::x2+7=0x2\\\\\\\\\\\\\\\\\\\\\\\\\\\\\\\\\\\\\\\\i7\\\\\\\\\\\\\\\\\\\\\\\\\\\\\\\\\\\\\\\\\\\\\\\\\\\\\\\\\\\\\\\\\\\\\\\\\\\\\\\\\\\\\\\\\\\\\\\\\\\\\\\\\\\\\\\\\\\\\\\\\\\\\\\\\\\\\\\\\\\\\\\\\\\\\\\\\\\So the solutions are and , a total of four zeros of . Keep in mind that only the real zeros of a function correspond to the intercept of its graph.
::所以答案是 22 和 i7, 总共是 f(x) 的 4 零。 请记住, 函数的实际 0 与 图中的 x- intermission 相对应 。Example 6
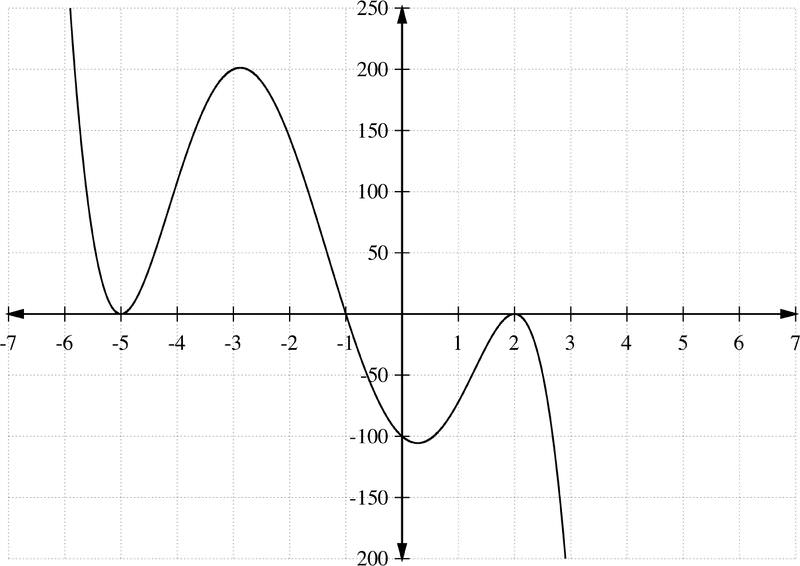
::例6Graph .
::图g(x)(x-2)2(x+1)(x+5)3。Use the zeros to create a table of intervals and see whether the function is above or below the axis in each interval:
::使用 0 来创建间隔表, 并查看函数是否高于 X- 轴, 并在每个间隔中低于 x- 轴 :Interval Test value Sign of Location of graph relative to axis -6 320 + Above -5 0 NA (-5, -1) -2 144 + Above -1 0 NA (-1, 2) 0 -100 - Below 2 0 NA 3 -256 - Below Finally, use this information and the test points to sketch a graph of .
::最后,使用这些信息和测试点绘制 g(x) 的图形。Review
::回顾-
If
c
is a zero of
f
, then
c
is a/an _________________________ of the graph of
f
.
::如果 c 是 f 的零,则 c 是 f 图表中的 a/ an 。 -
If
c
is a zero of
f
, then (
x
-
c
) is a factor of ___________________?
::如果 c 为 f 零 , (x - c) 是 __ 系数 ? -
Find the zeros of the polynomial:
::查找多边数的零: P(x)=x3- 5x2+6x
Consider the function: .
::考虑函数 : f(x)\%3(x)- 3) 4(5x-2)(2x- 1) 3(4- x) 2。-
How many zeros (x-intercepts) are there?
::有多少个零(x-截取)? -
What is the leading term?
::前期任期是什么?
Find the zeros and graph the polynomial. Be sure to label the x -intercepts, y -intercept (if possible) and have correct end behavior. You may use technology for questions 9-12.
::查找零, 并绘制多数值图。 请务必标出 X 的截取、 y 截取( 如果可能的话) 和正确的结束行为 。 您可以使用技术处理问题 9-12 。-
::P(x) 2(x+1) 2(x- 3) -
::P(x) =x3+3x2-4x-12 -
::f(x) = 2x5+4x3+8x2+6x -
: -
: -
Given:
::依据:P(x)=(3x+2)(x-7)(2)(9x+2)3
State:
::状态 :-
The leading term:
::前一任期: -
The degree of the polynomial:
::多面性的程度 : -
The leading coefficient:
::主要系数:
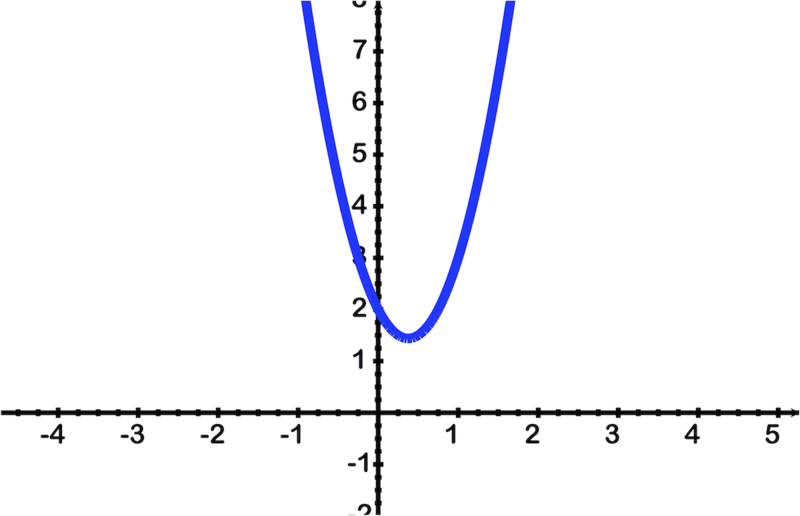
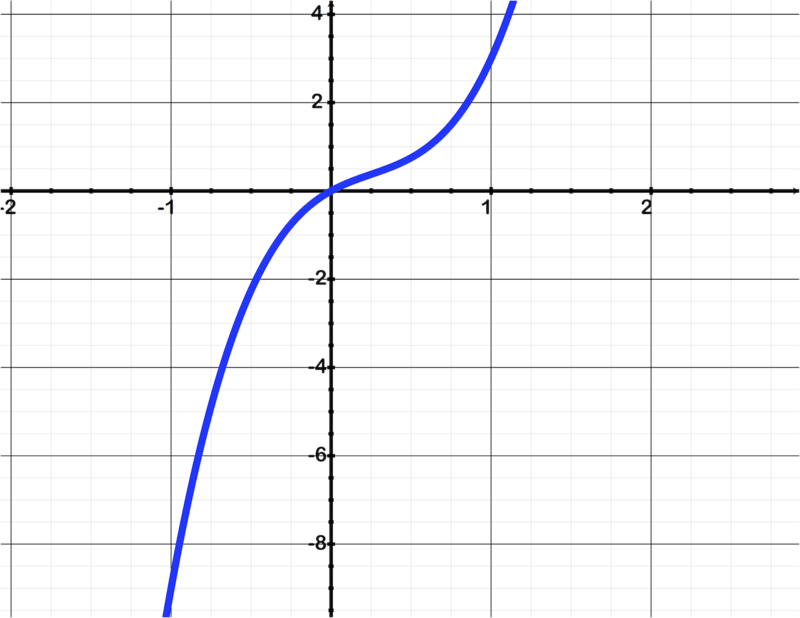
Determine the equation of the polynomial based on the graph:
::确定基于图形的多数值方程式 :Review (Answers)
::回顾(答复)Click to see the answer key or go to the Table of Contents and click on the Answer Key under the 'Other Versions' option.
::单击可查看答题键, 或转到目录中, 单击“ 其他版本” 选项下的答题键 。 -
Use the leading-
term
test to determine the end behavior of the graph.