3.6 对数函数图
章节大纲
-
are in many ways similar to , and can be applied in similar situations.
::在许多方面与......相似,可以适用于类似情况。Log functions can be used to model radioactive decay (to estimate the age of fossils, for instance), or estimate the discharge of electricity from a capacitor. Logarithmic functions can be graphed to allow quick and reasonably accurate estimation of the useable area of a WiFi network, or estimate the minimum length of a filtering pipe in order to have a specific purity of kerosene.
::日志功能可用于模拟放射性衰变(例如,估计化石的年代)或估计电容器的电流。 对数功能可以绘制图表,以便快速和合理地准确估计无线网络的可用区域,或者估计过滤管的最小长度,以便有特定的煤油纯度。As you work with the graphs of log functions in this lesson, you will notice that they bear a resemblance to another family of graphs which you have explored already. At the end of the lesson, we will revisit this fact.
::当您使用此课中日志函数的图表时, 您会注意到它们与您已经探索过的另一组图表相似 。 课程结束时, 我们将重温这个事实 。Can you identify what other family the log functions resemble, and explain in your own words why that is the case before the review?
::您能否找出日志函数的其他相似的家族, 并用您自己的语言解释为何在复查前出现这种情况?Graphing Logarithmic Functions
::图形对数函数In a previous lesson, log functions were identified as the inverses of exponential functions, in this lesson we explore that fact visually through the .
::在以前的一个教训中,日志函数被确定为指数函数的反转,在这个教训中,我们通过视觉来探讨这一事实。As you can see below, because the function f ( x ) = log 2 x is the inverse of the function g ( x ) = 2 x , the graphs of these functions are reflections over the line y = x .
::如下文所示,由于函数 f(x) = log2x 是函数 g(x) = 2x 的反向,这些函数的图形是 y = x 的反射。We can verify that the functions are inverses by looking at the graph. For example, the graph of g ( x ) = 2 x contains the point (1, 2), while the graph of f ( x ) = log 2 x contains the point (2, 1).
::我们可以通过查看图形来核实函数是反向的。例如,g(x) = 2x 的图包含点(1,2),而f(x) = log2x 的图包含点(2,1)。Also, note that while that the graph of g ( x ) = 2 x is asymptotic to the x- axis, the graph of f ( x ) = log 2 x is asymptotic to the y- axis. This behavior of the graphs gives us a visual interpretation of the restricted range of g and the restricted domain of f.
::注意, g( x) = 2x 的图形虽然对 x 轴没有反应,但 f( x) = log2x 的图形对 y 轴没有反应。 图的这一行为给我们提供了对 g 限制范围以及 f 限制范围的直观解释。When graphing log functions, it is important to consider x- values across the domain of the function. In particular, we should look at the behavior of the graph as it gets closer and closer to the asymptote. Consider f ( x ) = log 2 x for values of x between 0 and 1.
::当图形化日志函数时,必须在整个函数的域内考虑 x 值。特别是,当该图接近和接近星点时,我们应查看该图的行为。对于0到1之间的x值,请考虑 f(x) = log2x。- If x = 1/2, then f (1/2) = log 2 (1/2) = -1 because 2 -1 = 1/2
- If x = 1/4, then f (1/4) = log 2 (1/4) = -2 because 2 -2 = 1/4
- If x = 1/8, then f (1/8) = log 2 (1/8) = -3 because 2 -3 = 1/8
From these values you can see that if we choose x values that are closer and closer to 0, the y values decrease (heading towards !). In terms of the graph, these values show us that the graph gets closer and closer to the y- axis. Formally we say that the vertical asymptote of the graph is x = 0.
::从这些数值中可以看到,如果我们选择接近 0 的 x 值,y 值就会下降(标题指向 \\\\\\\\\\\\\\\\\\\\\\\\\\\\\\\\\\\\\ x\\\\\\\\\\\\\\\\\\\\\\\\\\\\\\\\\\\\\\\\\\\\\\\\\\\\\\\\\\\\\\\\\\\\\\\\\\\\\\\\\\\\\\\\\\\\\\\\\\\\\\\\\\\\\\\\\\\\\\\\ x\\\\\\\\\\\\\\\\\\\\\\\\\\\\\\\\\\\\\\\\\\\\\\\\\\\\\\\\\\\\\\\\\\\\\\\\\\\\\\\\\\\\\\\\\\\\\\\\\\\\\\\\\\\\\\\\\\\\\\\\\\\\\\\\\\\\\\\\\\\\\\\\\\\\\\\\\\\\\\\\\\\\\\\\\\\\\\\\\\\\\\\\\\\\\\\\\\\\\\\\\\\\\\\\\\\\\\\\\\\\\\\\\\\\\\\\\\\\\\\\\\\\\\\\\\\\\\\\\\\\\\\\\\\\\\\\\\\\\\\\\\\\\\\\\\\\\\\\\\\\\\\\\\\\\\\\\\\\\\\\\\\\\Graphing Logarithmic Functions Using Transformations
::使用变形绘制对数函数图Consider again the log function f ( x ) = log 2 x . The table below summarizes how we can use the graph of this function to graph other related functions.
::再次考虑日志函数 f(x) = log2x。下表概述了我们如何使用此函数的图解来图解其他相关函数。Equation Relationship to f ( x ) = log 2 x Domain g ( x ) = log 2 ( x - a ), for a > 0 Obtain a graph of g by shifting the graph of f a units to the right. x > a g ( x ) = log 2 ( x + a ) for a > 0 Obtain a graph of g by shifting the graph of f a units to the left. x > - a g ( x ) = log 2 ( x ) + a for a > 0 Obtain a graph of g by shifting the graph of f up a units. x > 0 g ( x ) = log 2 ( x ) - a for a > 0 Obtain a graph of g by shifting the graph of f down a units. x > 0 g ( x ) = a log 2 ( x ) for a > 0 Obtain a graph of g by vertically stretching the graph of f by a factor of a . x > 0 g ( x ) = - a log 2 ( x ) , for a > 0 Obtain a graph of g by vertically stretching the graph of f by a factor of a , and by reflecting the graph over the x- axis. x > 0 g ( x ) = log 2 (- x ) Obtain a graph of g by reflecting the graph of f over the y -axis. x < 0 Examples
::实例Example 1
::例1Earlier, you were asked a question about a function family.
::早些时候,有人问你一个有关家庭功能的问题。Can you identify what other family the log functions resemble, and explain in your own words why that is the case?
::您能否辨别日志函数与哪个家族相似, 并用您自己的语言解释为何如此?By now, I am sure you are quite familiar with the answer, it was repeated several times throughout the lesson. Logarithmic function graphs are the inverses of exponential function graphs, because the very definition of a logarithmic function it as the inverse of an exponential function!
::现在,我敢肯定,你非常熟悉答案,答案在整个课程中多次重复。对数函数图是指数函数图的反面,因为对数图的定义将它作为指数函数的反面函数。Example 2
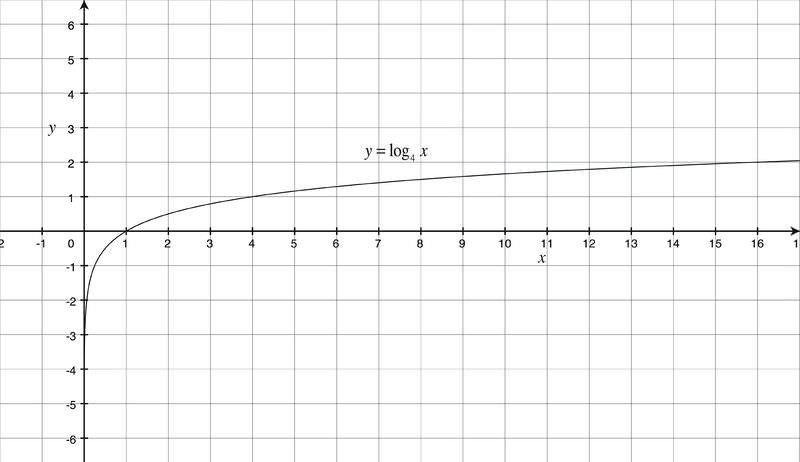
::例2Graph the function f ( x ) = log 4 x and state the domain and range of the function.
::绘制函数 f(x) = log4x 的图,并标出函数的域和范围。The function f ( x ) = log 4 x is the inverse of the function g ( x ) = 4 x . We can sketch a graph of f ( x ) by evaluating the function for several values of x , or by reflecting the graph of g over the line y = x .
::函数 f(x) = log4x 是函数 g(x) = 4x 的反方向。 我们可以通过评估 x 几个值的函数, 或通过在 y = x 线上反映 g 的图形, 绘制 f(x) = 4x 的图示。If we choose to plot points, it is helpful to organize the points in a table:
::如果我们选择绘制点,在表格中排列点会有所帮助:x y = log 4 x 1/4 1 0 4 1 16 2 The graph is asymptotic to the y- axis, so the domain of f is the set of all real numbers that are greater than 0. We can write this as a set: . While the graph might look as if it has a horizontal asymptote, it does in fact continue to rise. The range is .
::图形对 Y 轴没有符号性, 所以 f 的域是所有大于 0 的真实数字的一组。 我们可以将它写成一个集 : {x\\\\\\\\\\\\\\\\\\\\\\\\\\\\\\\\\\\\\\\\\\\\\\\\\\\\\\\\\\\\\\\\\\\\\\\\\\\\\\\\\\\\\\\\\\\\\\\\\\\\\\\\\\\\\\\\\\\\\\\\\\\\\\\\\\\\\\\\\\\\\\\\\\\\\\\\\\\\\\\\\\\\\\\\\\\\\\\\\\\\\\\\\\\\\\\\\\\\\\\\\\\\\\\\\\\\\\\\\\\\\\\\\\\\\\\\\\\\\\\\\\\\\\\\\\\\\\\\\\\\\\\\\\\\\\\\\\\\\\\\\\\\\\\\\\\\\\\\\\\\\\\\\\\\\\\\\\\\\\\\\\\\\\\\\\\\\\\\\\\\\\\\\\\\\\\\\\\\\\\\\\\\\\\\\\\\\\\\\\\\\\\\\\\\\\\\\\\\\\\\\\\\\\\\\\\\\\\\\\\\\\\\\\\\\\\\\\\\\\\\\\\\\\\\\\\\\\\\\\\\\\\\\\\\\\\\\Example 3
::例3Graph the following functions: f ( x ) = log 2 ( x ), g ( x ) = log 2 ( x ) + 3, and h ( x ) = log 2 ( x + 3).
::图中函数如下: f(x) = log2(x), g(x) = log2(x) + 3, h(x) = log2(x) + 3。The graph below shows these three functions together:
::下图显示了这三种功能的组合:Notice that the location of the 3 in the equation makes a difference! When the 3 is added to log 2 x , the shift is vertical. When the 3 is added to the x , the shift is horizontal. It is also important to remember that adding 3 to the x is a horizontal shift to the left. This makes sense if you consider the function value when x = -3:
::注意方程式中 3 的位置不同。 当将 3 添加到 log2x 时, 转换是垂直的。 当将 3 添加到 x 时, 转换是水平的。 记住在 x 中添加 3 是向左水平的转换, 也很重要 。 如果您在 x = - 3 时考虑函数值, 这一点是有道理的 :h (-3) = log 2 (-3 + 3) = log 2 0 = undefined
::h(-3) = log2(-3 + 3) = log20 = 未定义This is the vertical asymptote!
::这是垂直无序状态!Note that in order to graph these functions, we evaluated them by investigating specific values of x . If we want to know what the x value is for a particular y value, we need to solve a logarithmic equation.
::请注意,为了图解这些函数,我们通过调查 x 的具体值来评估这些函数。如果我们想知道 x 值对某个 y 值意味着什么,我们需要解析一个对数方程。Example 4
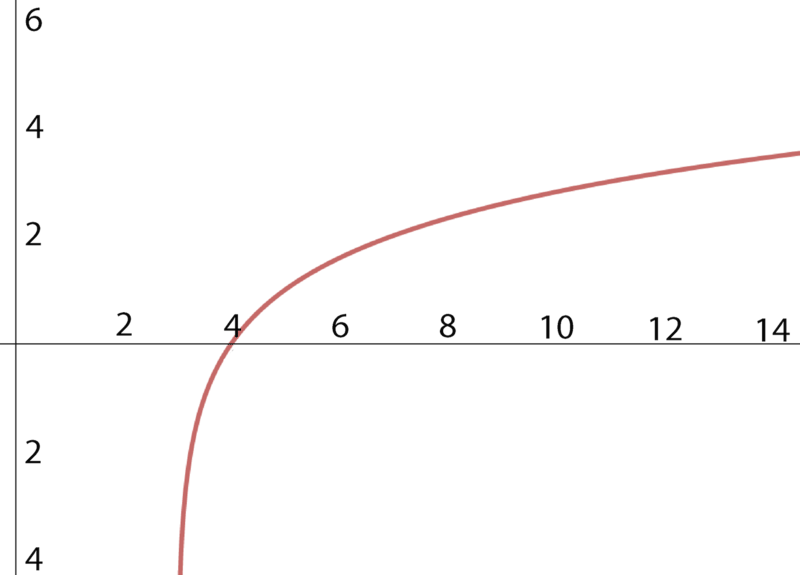
::例4Graph the function .
::函数 y=log2(x- 3) 图形。Start by making a table:
::以制表开始 :x y 3 4 0 5 1 6 1.585 7 2 8 2.32 Since that means and . That means that when .
::自 20=1 表示 x- 3=1 和 x= 4。 y= 0, x= 4 表示 y = 0, x= 4 。Since that means and . That means that when .
::21=2 表示 x- 3=2 和 x=5. 表示y= 1,x=5 表示y= 1,x=5。The graph looks like:
::图表看起来像:Example 5
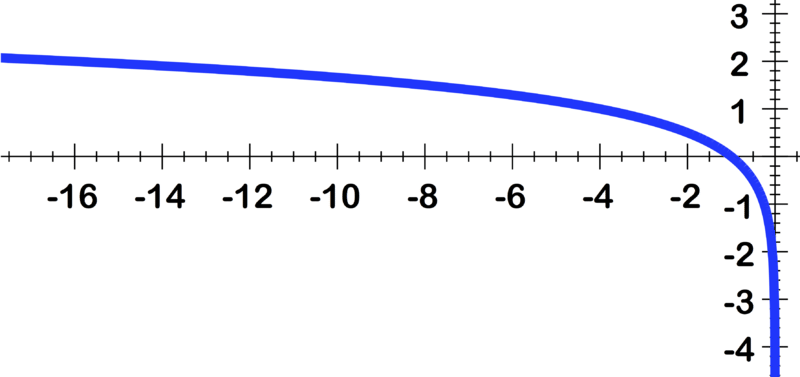
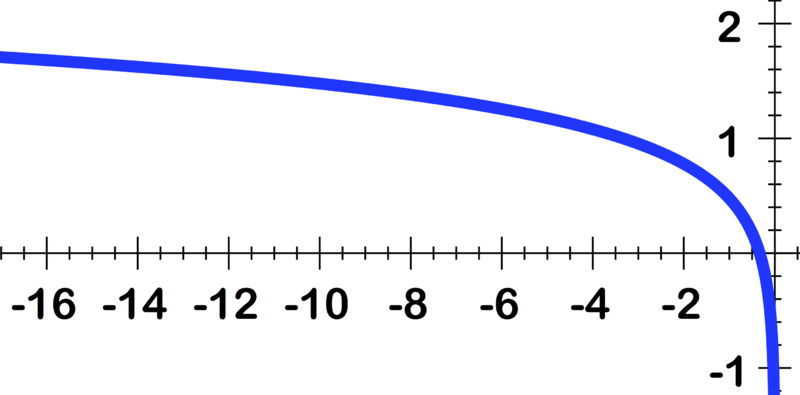
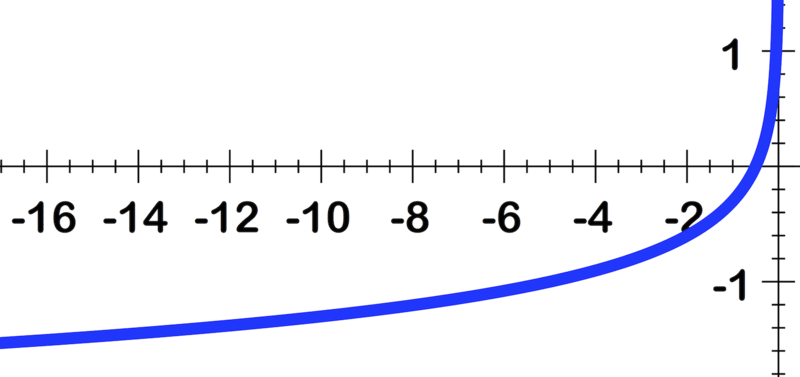
::例5Which of the following functions is graphed in the image below? a) , b) , or c) ?
::下列哪些函数在下面的图像中图表显示? a)y=log4x,b)y=log4x,或c)y=log4-x?All three functions are varieties of , but the image shows the function reflected across the axis, therefore c) is correct.
::所有三个函数都是log4x的品种, 但图像显示的函数在它们之间反射, 因此 c) y=log4-xis 正确 。Example 6
::例6Graph the function .
::绘制函数 y=log3x 。To graph we will start with a table of values:
::对于 y = log3x 的图形,我们将以一个数值表开始 :x y 3 1 9 2 27 3 81 4 Plotting those points and drawing a smooth curve between them gives:
::标出这些点并绘制它们之间的平滑曲线,可以提供:Review
::回顾Identify the domain and range, then sketch the graph.
::标明域和范围,然后绘制图表。-
::y=log6(x- 1)- 5 -
::y=log5(x- 1)+3 -
::y=log4( 3x+11) - 5 -
::y=log6( 3x+14)+1 -
::y=log5(2x+2)+5
Look at the graphs below and identify the function that the graph represents from the functions listed below.
::查看下方的图表,并确定图形代表以下所列函数的函数。- a)
- b)
- c)
- d)
- e)
Graph the following logarithmic functions.
::如下对数函数图解。-
::y=log10( 2x) -
::y=log12(x+2) -
::y=log3( 2x+2) -
- 19. The table below shows the x and y values of the points on an exponential curve. Switch them and identify the corresponding coordinates of the points that would appear on the logarithmic curve. Can you identify the function?
::- 19. 下表显示指数曲线上的点的 x 和 y 值,切换这些点,并确定对数曲线上出现的点的相应坐标。
-
-
Point on exponential curve Corresponding point on logarithmic curve (-3, 1/8) (1/8, -3) (-2, 1/4) 14. (__ , __) (-1, 1/2) 15. (__ , __) (0, 1) 16. (__ , __) (1, 2) 17. (__ , __) (2, 4) 18. (__ , __) (3, 8) 19. (__ , __)
-
Graph logarithmic functions, using the inverse of the related exponential function. Then graph the pair of functions on the same axes.
::图形对数函数,使用相关指数函数的反向。然后用图形显示相同轴上的函数对数。-
::y=log3x y=log3x -
::y=log5x y=log5x
Review (Answers)
::回顾(答复)Click to see the answer key or go to the Table of Contents and click on the Answer Key under the 'Other Versions' option.
::单击可查看答题键, 或转到目录中, 单击“ 其他版本” 选项下的答题键 。