2.3 分发
章节大纲
-
The local county fair is holding a raffle/competition, and the winner gets a $100 gift card. You would love to win the card, but the competition seems impossible! To enter, you have to guess how many M&M candies of each color: red, blue, yellow, brown, and green, are in a huge jar of M&M’s.
::当地县级博览会举办彩票/竞争比赛,获胜者获得100美元的礼品卡。 你很想赢得卡片,但竞争似乎是不可能的!要进入,你就必须猜到每个颜色的M&M糖果有多少:红色、蓝色、黄色、棕色和绿色,都装在一大罐的M & M的罐子里。There is certainly no way you can actually count them all, you can’t even see most of them since they are in the center and hidden by the candies on the outside. How could you use statistics to help you make an educated guess at the distribution of the colors? Would it help if you knew there were approximately 650 M&M’s in a pound, and about 5 pounds of candy in the jar?
::当然,你不可能真正计算所有,你甚至看不到大部分,因为它们位于中间,被糖果藏在外面。 你如何利用统计来帮助你对颜色的分布进行有教育性的猜测? 如果你知道每磅有大约650张M & M, 罐子里有大约5磅糖果,那有帮助吗?The answers are found after the lesson.
::答案是在课后找到的。Distribution
::分发分发情况One of the more important goals of a statistical data analysis is to determine the overall distribution of the data points. Are the values relatively close together? Do they conform to a specific pattern? Do values tend to occur in groups, or suggest a particular shape? By evaluating the distribution of the data, we not only improve our ability to predict future values, but can also determine how reliable the data is as a model of the real situation.
::统计数据分析中更重要的目标之一是确定数据点的总体分布情况。 数值是否相对接近? 它们是否与特定模式一致? 数值是按组出现,还是按特定形状出现? 通过评估数据分布,我们不仅提高了预测未来值的能力,而且还能够确定数据作为真实情况的模型的可靠性。
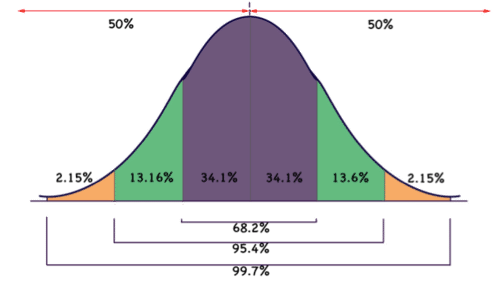
The most well-known and common distribution in statistics is the normal distribution , often referred to as a bell-curve . Normally distributed data follows a specific pattern of decreasing numbers of data points as values range further from the arithmetic mean (commonly known as the average) of the set. Specifically, in a normally distributed set of data, approximately 68% of all the data points are within 1 standard deviation of the mean, and 99.7% of the data lie within three standard deviations of the mean. Don’t worry if these terms seem confusing at this point, in subsequent lessons, particularly in the Predicting Values and Normal Distribution chapters, we will be detailing a more rigorous mathematical evaluation of distribution and standard deviation. For now, it is enough to know that if data is normally distributed, approximately (68.2%) of your results should have values within 1 “step” of the average value , and nearly all of your results (95.4%) should be within 2 “steps.”
::统计中最广为人知和最常见的分布是正常分布,通常被称为钟曲线。 通常分配的数据遵循的是数据点减少的具体模式,因为数值从数据集的算术平均值(通常称为平均 ) 更远。 具体地说,在正常分布的数据集中,所有数据点的大约68%在平均值的1个标准偏差之内,99.7%的数据在平均值的3个标准偏差之内。 不必担心这些术语在这一点上似乎令人困惑,在随后的教训中,特别是在预测值和正常分布章节中,我们将详细描述对分布和标准偏差的更为严格的数学评估。 现在,只要知道如果数据正常分布,大约23(68.2%)的结果应该在平均值的1个“步骤”之内,而你的所有结果(95.4%)几乎应该在2个“步骤”之内就足够了。In statistics, distribution may also refer to the differences among members of a sample or population. For instance, demographic distribution can be a major consideration when choosing subjects for a sample group. When many different members of a population are likely to respond differently to the same stimuli, it is usually important to attempt to maintain the same ratio of such differing responses as that of the entire population.
::在统计中,分布还可能指抽样或人口成员之间的差别,例如,人口分布在为抽样群体选择主题时可能是一个主要考虑因素,如果一个人口的许多不同成员对同一刺激的反应可能不同,通常必须设法维持与整个人口不同反应的相同比例。You will rarely or never collect data from a group made up of identical members, and differences in point of view or personal preference can have surprising effects on experimental results. The more precise you need your results to be, the more important it becomes to monitor the distribution of your sample.
::你很少或永远也不会从一个由相同成员组成的小组收集数据,而观点或个人偏好的差异会对实验结果产生惊人的影响。 越是精确地需要你的结果,监测抽样分布就越重要。There may be many differences among members of a sample group that influence responses. Common differences include age, size, sex, level of education, religion, culture, geographic location etc. Of course there are many less common characteristics that may affect the results of a study. The goal of a sample is to take into account as many such differences as possible and attempt to represent them in the same ratio as the entire population.
::抽样组的成员之间可能存在许多影响反应的差别,共同的差别包括年龄、规模、性别、教育水平、宗教、文化、地理位置等。 当然,许多不太常见的特征可能会影响一项研究的结果,抽样的目的是尽可能考虑到这种差别,并试图以与全体人口相同的比例代表这些差别。Considering Distribution
::考虑分发情况You are part of a student committee planning to install a vending machine beside the football field to sell snacks for the benefit of the football team. Naturally, you want to stock the machine with the most popular products, so you decide to conduct a poll of the likely consumers. A brainstorming session with the rest of your committee yields the following likely groups of consumers:
::您是学生委员会的一部分,该委员会计划在足球场旁边安装自动售货机,为足球队出售零食。 当然,您想要用最受欢迎的产品储存机器,因此您决定对可能的消费者进行民意调查。与您的委员会其他成员一起进行集思广益会议,产生了以下可能的消费者群体:-
Football players
::足球运动员 -
Cheerleaders
::啦啦领社 -
Parents
::父母父母 -
Coaches
::教练 -
Male students in the audience
::听众中男生学生人数 -
Female students in the audience
::听众中的女学生人数 -
Reporters
::报 报 员 -
Sports Scouts
::运动童子军
Your committee is split by the debate of how to best take the different demographics into account. Part of the committee believes you should ask equal numbers of each group to list their preferred snacks and drinks, and the other part thinks it would be best to give preference to the players and cheerleaders. Perhaps both groups are incorrect; might it not be most effective to buy items that the students in the audience would prefer?
::你们的委员会被关于如何最好地考虑不同人口统计的争论分成两部分。 委员会的一部分认为,你们应该要求每个组的同等数量的人列出他们喜欢的零食和饮料,另一部分则认为最好优先考虑运动员和拉拉队长。 也许这两个组不正确;买观众喜欢的物品是否最为有效?What do you think? What distribution considerations will result in the most sales from the vending machine?
::你觉得呢?什么分配考虑将导致自动售货机销售量最高?This problem illustrates the fact that simply representing the demographics of a population as closely as possible may not be the most effective distribution of a sample. Often it is important to identify which statistics are the most valuable to your particular study. In order to maximize sales from the vending machine, it would probably be much more valuable to stock it primarily with items most appealing to the male students in the audience, as they are the most likely to have the desire, freedom, and money to spend on snacks during a game. Additionally, they probably represent the largest single group, followed closely by the female students and then the players and cheerleaders.
::这个问题表明,仅仅尽可能近地代表一个人口的人口组成情况,也许不是最有效的抽样分布。通常重要的是要确定哪些统计数字对你们的特定研究最有价值。为了尽量扩大自动售货机的销售量,首先储存对观众中男生最有吸引力的物品或许更有价值,因为他们最有可能有欲望、自由和金钱在游戏中花在零食上。此外,它们可能代表最大的单一群体,紧随其后的是女生,然后是运动员和拉拉队长。Taking these considerations into account, you should identify a sample that is primarily composed of male students, with a smaller number of female students. The other groups are either unlikely to have statistically significant differences in preferences anyway, or are just not numerous enough to be significant.
::考虑到这些考虑,您应该找到一个样本,样本主要由男生组成,女学生人数较少,其他群体或者在统计学上不可能出现显著的偏好差异,或者数量不够,无法显著。Determining Probability
::确定概率of all households will spend between $700 and $840:In your economics class, you are studying shopping expenditures during the holiday season. The data indicates that the average household will spend approximately $770 on gifts during the month of November. Assuming the data is normally distributed.
::所有家庭中有23个家庭将在700美元到840美元之间支出:在你们的经济课上,您正在研究节假日的购物开支,数据显示,平均家庭在11月份将花费大约770美元用于礼品,假设通常分发数据。
Recall that normally distributed data suggests that of the data points occur within 1 standard deviation of the average, and that 95% occur within 2 standard deviations. If of the households spent between $700 and $840, that would indicate that 1 standard deviation represents $70 since $700 and $840 are each $70 away from the average of $770.
::回顾通常分发的数据表明,23个数据点出现在平均数的1个标准差之内,95%出现在2个标准差之内,如果23个家庭花费在700美元至840美元之间,则表明1个标准差为70美元,因为700美元和840美元,每个标准差为70美元,而平均差为770美元。1. What is the likelihood that any given household will spend more than $910?
::1. 任何家庭支出超过910美元的可能性有多大?Since $910 is $140 more than the mean expenditure of $770, that means that it is or 2 standard deviations above the mean. We can assume that approximately 95% of all values are less extreme than $910, meaning that only 5% will be further than $140 away from the average. Since half of the remaining 5% of households (2.5%) would be made up of the families who will spend an extremely small amount (less than $630), we can assume the other 2.5% to spend more than $910 .
::由于910美元比平均支出770美元高出140美元,这意味着平均支出是2x70美元或2个标准差。 我们可以假设,所有价值的约95%低于910美元,这意味着只有5%将比平均支出高出140美元。 其余5%的家庭(2.5%)的一半(不到630美元)将由支出极小的家庭组成,我们可以假设其他2.5%将支出超过910美元。2. What is the chance that a household will spend less than $700?
::2. 家庭支出低于700美元的可能性有多大?$700 is 1 standard deviation below the mean, so approximately of all values are less extreme, and are more extreme. of the values will be more than 1 standard deviation above the mean, and below, so we should expect approximately of the households in the study to spend less than $700.
::700美元是低于平均值的1个标准差,因此,所有值中约有23个值不那么极端,13个值更极端。 16个值将超过平均值的1个标准差,16个值将高于平均值,16个值低于平均值,因此,我们预计研究中大约16个家庭的支出不到700美元。Calculating the Average Distribution
::计算平均分配情况Suppose you are attempting to estimate the demographic distribution of a school football game. Given the size and constant motion of the crowds, you quickly realize that counting them all isn’t going to work well. Deciding to use a random sample instead, you pick a few different groups at random to calculate the average distribution of the crowd.
::假设你试图估算学校足球赛的人口分布。 考虑到人群的大小和持续运动,你很快就意识到计算这些人群是行不通的。 决定使用随机抽样代替,你随机挑选几个不同的群体来计算人群的平均分布。a. If you observe a total of 50 people, and count 22 male students, 17 female students, 9 parents, and 2 others, what would be the average demographic distribution of the crowd appear to be as a percentage?
::a. 如果你总共观察50人,并统计22名男学生、17名女学生、9名父母和2名其他学生,那么,人群的平均人口分布似乎百分比是多少?To calculate the contribution of each group to the whole as a percentage, divide the number of members in each group by the total members you counted:
::为计算每个集团对整体的贡献百分比,将每个集团的成员数目除以所计算的成员总数:
::2250=444-44% 男生1750=343 34% 女生950=1850=18% 父母250=0.044% 其他b. If sales records indicate a total of 475 tickets sold, what would you estimate the actual count of each demographic to be?
::b. 如果销售记录显示共售出475张机票,那么,你对每一人口的实际数字估计多少?To estimate the total distribution of the crowd, multiply each group’s estimated percentage by the total number of tickets sold:
::为了估计人群的分布,将每个群体的估计百分比乘以售出的罚单总数:
::44475=209男学生 34475=162女学生18475=86父母4475=19其他学生Earlier Problem Revisited
::重审先前的问题Guess how many M&M candies of each color: red, blue, yellow, and brown, are in a huge jar.
::猜猜每个颜色(红色、蓝色、黄色和棕色)的M&M糖果有多少,There is certainly no way you can actually count them all, you can’t even see most of them since they are in the center and hidden by the candies on the outside. How could you use statistics to help you make an educated guess at the distribution of the colors? Would it help if you knew there were approximately 650 M&M’s in a pound, and about 5 pounds of candy in the jar?
::当然,你不可能真正计算所有,你甚至看不到大部分,因为它们位于中间,被糖果藏在外面。 你如何利用统计来帮助你对颜色的分布进行有教育性的猜测? 如果你知道每磅有大约650张M & M, 罐子里有大约5磅糖果,那有帮助吗?If you identify an average ratio of colors in a sample of the candies, you could apply that ratio to the estimated total number of candies in the jar.
::如果您在糖果样本中确定平均颜色比例,您可以对罐中糖果估计总数应用该比例。If there are approximately 650 candies in a pound, and 5 pounds in the jar, we can estimate a total of approximately 3,250 total candies. To get an average distribution of colors, we could either use a sample of the candies we can see through the side of the jar and calculate the percentage of each, or we could research online to see what the company advertises: 24% blue, 13% red, 14% yellow, 14% brown (16% green and 20% orange, but the raffle doesn’t ask about them).
::如果每磅大约有650个糖果,罐子里有5磅,那么我们可以估计总共大约3,250个糖果。 为了平均分配颜色,我们可以使用从罐子的侧面可以看到的糖果样本,计算每罐子的百分比,或者我们可以在线研究,看看公司广告的内容:24 % 蓝色, 13 % 红色, 14% 黄色, 14 % 棕色(16% 绿色, 20 % 橙) , 14 % 棕色(16% 橙色, 绿色, 20 % 橙色) , 但是拉斐尔并不问它们。
::3250=780估计蓝色的24%
::估计红色3250=423的13%
::3250=455的14%,估计每个黄色和棕色Of course this is no guarantee of the actual numbers of each color, but given the relatively large sample size, these numbers are likely to be quite a bit more accurate than a simple guess.
::当然,这并不能保证每种颜色的实际数字,但鉴于抽样规模相对较大,这些数字可能比简单的猜测更准确一些。Examples
::实例Example 1
::例1Suppose a group of 150 students in a college English course take a final exam, and the instructor calculates that the mean score is 87%, with a standard deviation of 3%.
::假设一组150名学生在大学英语课程中参加期末考试,教员计算出平均得分为87%,标准差为3%。If the scores are normally distributed, what is the approximate probability that a randomly selected score will be between 87% and 93%?
::如果得分通常分布在87%至93%之间,随机选择得分的概率是多少?Recall that normally distributed data indicates approximately 68.2% of values within 1 standard deviation of the mean, and 95.4% within 2 standard deviations. Also, recognize that if 68.2% of values are within 1 SD of the mean, then 34.1% are within 1 SD above the mean, and 34.1 are below the mean, as you can see in the graphic:
::回顾通常分发的数据显示值的68.2%在平均值的1个标准差之内,95.4%在2个标准差之内。此外,还认识到,如果68.2%的数值在平均值的1SD之内,那么34.1%在平均值的1SD之内,34.1%在平均值之上,而34.1%低于平均值,如图中所示:
.
Since the standard deviation of the grades is 3%, there are two standard deviations between 87% and 93%. If we look at the percentages above 87% for the next two standard deviations, we see that the first incorporates 34.1% of the data, and the second incorporates another 13.6%. Therefore the likelihood that a given score will be between 87% and 93% is 34.1% + 13.6% = 47.7%
::由于各年级的标准差值为3%,因此在87%和93%之间有两种标准差。如果我们看看下两个标准差值超过87%的百分比,我们可以看到第一个标准差值包含34.1%的数据,第二个标准差值包含另外13.6%的数据。因此,一个得分在87%和93%之间的可能性是34.1%+13.6%=47.7%。Example 3
::例3In the same class, what is the approximate probability that a randomly selected score will be between 84% and 87%?
::在同一类中,随机选择得分在84%至87%之间的概率是多少?84% is 1 standard deviation below the mean, so the probability that a randomly selected score will be between 84% and 87% is .
::84%是低于平均值的1个标准差,因此随机选择得分在84%至87%之间的概率是34.1%。Example 4
::例4If the rainfall in Denver during the month of May has a mean of and a standard deviation of , what is the approximate probability that a randomly selected May will have more than of rain?
::如果5月份丹佛的降雨量平均为2.4,标准偏差为4,那么随机选择的5月份降雨量超过2的概率是多少?Because normally distributed data have the same mean and median, we can start by noting that only 1/2 of months will have a rainfall of less than the median: 2.4%. Additionally, another 34.1% will have between 2" and 2.4" of rain, since 2" is once standard deviation away from the mean. That means a total of 50% + 34.1% = 84.1% of months will have more than 2" of rain.
::由于通常分布的数据的平均值和中位数相同,我们可以首先指出,只有四分之一月的降雨量将低于中位数:2.4%。 此外,还有34.1%的降雨量将达到2“至2.4”雨量,因为2年是距离平均值的标准差。这意味着总共50%+34.1%=84.1%的月降雨量将超过2个雨量。Example 5
::例5Assuming the same statistics, what is the approximate probability of receiving between and ?
::假设同样的统计数字,2至3.2之间收到的概率是多少?of rain is 1 standard deviation below the mean, and is 2 SD’s above the mean. Since there are 68.2% of values within 1 SD above and below the mean, and 13.6% between 1 and 2 SD’s above the mean, there would be
::降雨量比平均值低1个标准差,而3.2个标准差比平均值高2个SD。 由于平均值高于和低于1个SD值的68.2%,1个SD值高于平均值的13.6%,2个SD值高于平均值的13.6%,降雨量在2个SD至3.2个之间的月中将达到6.8 % 13.6 81.8 % 。6.8% + 13.6% = 81.8% of months with rainfalls between 2" and 3.2"
::6.8% + 13.6% = 81.8% 月降雨量在2"至3.2"之间。Review
::回顾-
Carfax rates its cars annually on customer satisfaction. If Clara researches last years’ Mazda, and discovers thatit received a mean customer satisfaction rating of 85, with a standard deviation of 4. Assuming the data is normally distributed, what is the probability that Clara herself would give it a rating between 81 and 89?
::Carfax每年根据客户满意度对汽车进行收费。 如果Clara研究去年的Mazda,并发现它得到85度的平均客户满意度,标准偏差为4. 假设数据正常分布,Clara自己给它81至89度的评级的可能性有多大? -
Caleb will be taking a math test tomorrow to make up for the one he missed last week when he was sick. The scores of the students in the class who took it on time were normally distributed with a mean of 84% and a standard deviation of 3%. What is the probability that Caleb will get at most an 81 on the test?
::Caleb明天将接受数学测试,以弥补他上星期生病时错过的数学测试。 正常情况下,上课学生的分数平均为84%,标准偏差为3%。 Caleb在考试中最多能得到81分的可能性是多少? -
Jonah is looking over the final exam scores of the previous year’s graduates in the Engineering program from which he is about to graduate. The final exam scores of students were normally distributed with a mean of 70 and a standard deviation of 4. What percentile would Jonah be in if he scores a 78 on the final exam?
::Jonah正在看上一年毕业生在工程计划的最后考试成绩,他即将从中毕业。 学生的最后考试成绩通常平均分配为70分,标准差为4分。 如果Jonah在最后考试中得78分,那么他会有多少百分率? -
Scores of each of the previous winners in the state championships for “States Best Chili” were normally distributed with a mean of 74 and a standard deviation of 5. Sarah is competing tomorrow. What is the probability of her winning with a score of between 79 and 84 on her chili?
::在州“最佳奇利州”冠军赛中,以往的每个获奖者得分通常平均为74分,标准偏差为5分。 Sarah明天要竞争。 在辣椒比赛中,她赢得79分到84分的可能性有多大? -
Scores on previous drivers tests taken by 16 year oldswere normally distributed with a mean of 82 and a standard deviation of 3.1. George will be taking the driving test tomorrow, what is the probability that he will receive at least an 88.2 on the test?
::16岁的Swere以前进行的驾驶员考试的分数通常平均为82分,标准偏差为3.1分。 George明天将参加驾驶考试,在考试中至少得到88.2分的可能性有多大? -
Previous biology test scores were normally distributed with a mean of 76 and a standard deviation of 2.8. Peter will be taking the test tomorrow. What is the probability of Peter getting at most 78.8 on the test?
::以前的生物学测试分数通常平均分布为76分,标准偏差为2.8分。 Peter明天将参加测试。 Peter在测试中最多获得78.8分的可能性有多大? -
A correlation was found between previous winnersof the Noble Peace Prize and their test scores on a standardized test. Every person scoring at least 2 standard deviations above the mean on the test went on to receive a Nobel Peace Prize, and no person with less than that did receive the prize. If the trend continues, and if the standardized test scores were normally distributed with a mean of 89 and standard deviation of 1.4, will Susan go on to win a Noble Peace Price if she earned a 91.6 on the test?
::诺贝尔和平奖前获奖者与标准测试中他们的测试分数之间找到一个相关关系。 每个得分至少比测试平均值高出2个标准差的人都会获得诺贝尔和平奖,没有比得奖者少的人会得到该奖。 如果这一趋势继续下去,如果标准测试分通常以89和1.4标准差来分配,苏珊如果在测试中赢得91.6,她是否会继续赢得诺贝尔和平奖? -
Recent competitors in “Battle of the Bands” received competition scores that were normally distributed with a mean of 89 and a standard deviation of 3.5. “Heavy Metal Trash Cans” will be competing this weekend. What is the probability of the band scoring between 82 and 91.5 in the competition?
::最近“乐队之战”中的竞争对手获得的竞争分数通常平均为89分,标准偏差为3.5分。 “重金属垃圾罐”本周末将竞争。 在比赛中,分数在82至91.5之间的概率是多少? -
Tami wants to become a flight attendant but must take a test to do so. Applicants that took the test earned scores that were normally distributed with a mean of 80 and standard deviation of 2.1. Tami will be taking the test today. What is the probability of Tami getting at least 77.9 on the assessment?
::塔米想成为一名空服人员,但必须接受测试才能这样做。 接受测试的申请人获得的分数通常平均为80分,标准差为2.1分。 塔米今天将接受测试。 塔米至少得到77.9分的评估概率有多大?
Review (Answers)
::回顾(答复)Click to see the answer key or go to the Table of Contents and click on the Answer Key under the 'Other Versions' option.
::单击可查看答题键, 或转到目录中, 单击“ 其他版本” 选项下的答题键 。 -
Football players