4.8 创建口述信箱和口述口语笔
章节大纲
-
If you were asked to create a visual representation of the mean, upper and lower 25% (quartiles), and maximum and minimum (extremes) scores on the final test in your College Algebra class, how would you go about it? Would a box-and-whisker plot be appropriate? Why or why not? What would the plot look like if the mean was 82%, the lowest score was 59%, highest was 96%, and if a quarter of the class scored above 86% while another quarter scored below 70%?
::如果要求您在您的大学代数班的最后考试中创建中值、上值和下值25%(夸蒂尔斯)以及最高值和最小值(极端)分数的直观表示,您将如何进行呢?一个盒子和耳机的图案是否合适?为什么或为什么不合适?如果平均值是82%,最低分是59%,最高分是96%,如果四分之一的班级得分超过86%,而另一季度得分低于70%,这个图案会是什么样子?Creating Box-and-Whisker Plots
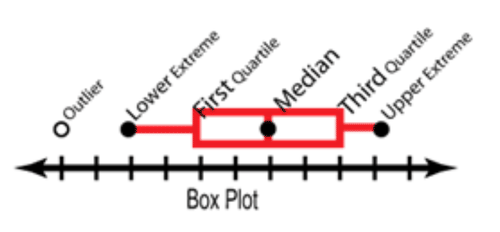
::创建纸箱和口述口语笔Box-and-whisker plots (or box plots ) are ideal for visually representing the of data .
::箱式和耳机式地块(或箱式地块)对于直观地代表数据是理想的。First, organize the data by increasing value, then
::首先,通过增加值来组织数据,然后The five number summary (or five statistical) is composed of:
::5个数字摘要(或5个统计)包括:-
The minimum and maximum values – called the
extremes
::最小值和最大值 — — 称为极端值 -
The middle value – called the
::中间值 — — 称为 -
The values halfway between each extreme and the median – called the
quartiles
.
::每个极端值和中位数之间的中间值 — — 称为四分位数。
It is important to recognize that a five number summary is more dependent on the position of each value in numerical order than on the value itself. A common confusion when for a box plot is to think that the plot is based on the arithmetic mean of the data rather than the median, don’t fall into this trap! To create a box plot, which is based on the fine number summary, you first need to organize your data in increasing numerical order, and then identify your five numbers based on position in the ascending series.
::必须认识到,五个数字摘要更多地取决于每个数值的数值顺序,而不是数值本身。对于一个框图来说,一个常见的混淆是认为图是根据数据的算术平均值而不是中位数算出的,而不是中位数。要创建一个基于精细数字摘要的框图,你首先需要将数据组织起来,增加数字顺序,然后根据上行序列的位置确定五个数字。A sometimes tricky detail is the handling and identification of outliers . Once you have identified the median and quartiles of your data, you should review the values at the lower and upper limits to see if there are any that seem unusually extreme before considering them to be part of your 5 number summary. Specifically, data points that are more than 1.5 times the inter- quartile range (the range of values between the first and third quartiles – representing the middle half of your data), may be considered mild outliers . Any points more than 3 times the inter-quartile range may be considered extreme outliers . Outliers are commonly plotted as stars or asterisks (mild outliers) or open circles (extreme outliers), and are not a part of the actual box plot or the five number summary.
::有时一个棘手的细节是外层的处理和识别。 一旦您确定了数据中的中位数和四位数, 您就应该审查下限和上限值, 看看是否有看起来异常极端的值, 然后再考虑它们是否属于您5个数字摘要的一部分。 具体地说, 数据点是分子间范围( 代表您数据中半部分的第一和第二位四位数之间的值范围)的1.5倍以上, 可以被认为是温和的外层。 任何点, 都可以被认为是分子间值的3倍以上。 外层通常被描绘成恒星或星风险( Mild outliers) 或打开圈( extreme extliers) , 而不是实际框图或5个数字摘要的一部分 。Once you have identified your five number summary, create a number line extending at least 10% past the upper and lower extremes of your data, and plot each of the five numbers above the appropriate locations on the line. Now create a rectangular box with sides on the 1 st and 3 rd quartiles. Draw a vertical line inside the box to represent the median, and draw horizontal lines from the sides of the box to the extremes. Finally, identify any mild outliers with asterisks/stars and extreme outliers with open circles.
::确定五个数字摘要后, 创建一个数字行, 长度至少要超过数据上下极端的10%, 并绘制在线上相应位置上方的五个数字的每一个。 现在创建一个长方形框, 其侧面在 1 和 3 个四角上方。 在框内绘制一条垂直线以代表中位, 从框的侧面绘制水平线到最极端。 最后, 指定有星号/ 星号/ 恒星号的温和外端, 以及有开阔圆的极端外端 。Creating a Five Number Summary
::创建五号摘要1. Create a five number summary for the data below, and identify any outliers:
::1. 为以下数据建立5个数字摘要,并查明任何外部线:1, 5, 8, 2, 1, 7, 4, 4, 5, 6, 8, 2, 6, 5, 9
A five number summary includes the median, the upper and lower extremes, and the first and third quartiles. The first step to identifying them is to organize the data by ascending numerical value:
::5个数字摘要包括中位数、上限和下限,以及第一和第二个四分位数。1, 1, 2, 2, 4, 4, 5, 5, 5, 6, 6, 7, 8, 8, 9
-
Finding the median: Note that there are 15 values, an odd number, so the middle number in the series is the median. The value “5” has 7 values above and 7 below.
5 is the median
.
::查找中位数 : 注意有 15 个值, 一个奇数, 所以序列中的中位数是中位数 。 “ 5” 值高于 7 个值, 低于 7 个值 。 5 是中位数 。 -
The 1
st
quartile is the median of the lower half of the data. There are 7 values below the median, and the middle number of them is “2”, with three values below and three above before the median.
The 1
st
quartile is 2
.
::第一个四分位数是数据中下半部的中位数。 中位数下方有7个值, 其中中位数为“ 2 ” , 中位数为“ 2 ” , 中位数下方有3个值, 中位数前方有3个值。 第一位四分位数为 2 。 -
The 3
rd
quartile is the median of the upper half of the data. There are 7 values above the median, and the middle value is “7”, with three values above it and three below it before the median.
7 is the 3
rd
quartile
.
::第三个四分位数是数据上半部的中位数。 中位数比中位数高7个值, 中位数是“ 7 ” , 中位数比中位数高3个, 中位数比中位数低3个。 7 是中位数第3个四分位数。 -
Are there any outliers? The inter-quartile range is the difference between the 1
st
and 3
rd
quartiles:
. Recall that a value should be considered an
outlier
if it is unusually low in frequency and greater than 1.5 times the inter-quartile range from the median. In this case, than would mean any number more than 7.5 above the 3
rd
quartile, 7, or below the 1
st
quartile, 2. That would make any value less than -5.5 or greater than 14.5 be considered a mild outlier. There are no negative values and no values greater than 9, so
there are no outliers
.
::是否有外线? 分子间差是第1和第3四分位数之间的差数: 7-2=5. 提醒注意,如果某一值频率异常低,比中位数的异乎寻常地高1.5倍以上,则该值应视为外线值。在此情况下,超过第3四分数以上7.5以上的数值,比第7位数或第1位四分位数以下的任何数值,比第2位数多7.5, 任何数值小于-5.5或大于14.5的值,都被视为温和的外线值。没有负值,也没有大于9的值,因此没有外线值。 -
The minimum and maximum values are the least and greatest values, respectively. Since we have organized our data in ascending order, the minimum value is on the far left, “1”, and the maximum value is on the far right, “9”.
The minimum is 1 and the maximum is 9.
::最低为1,最高为9。
::最小值和最大值分别为最小值和最大值。由于我们的数据按上行顺序排列,最低值在最左的“1”上,最大值在最右的“9”上,最低值为1,最高值为9。
2. Identify the five statistical summary and any outliers in the data below:
::2. 确定以下数据中的五个统计摘要和任何外部值:18, 16, 18, 17, 15, 2, 17, 20, 19, 18, 15, 16, 28, 18
Begin by ordering the data numerically:
::开始以数字顺序排序数据 :2, 15, 15, 16, 16, 17, 17, 18, 18, 18, 18, 19, 20, 28
-
Median: There are 14 values, an even number, so the median is the
average
(arithmetic mean) of the two middle numbers, 17 and 18.
17.5 is the median
.
::中位数:有14个值,一个偶数,因此中位数是中位数中两个中位数(17岁和18岁)的平均值(伸缩平均值),17.5是中位数。 -
1
st
and 3
rd
quartiles: The middle number in the lower 50% is 16, and the middle of the upper 50% is 18.
16 is the
lower quartile
and 18 is the
upper quartile
.
::第1和第3四分位数:中位数在下50%为16,中位数在上50%为18,中位数在下四分位数为16,中位数为18,中位数为下四分位数为16,中位数为上四分位数为18。 -
The inter-quartile range is
. Any value less than 13 or greater than 21 may be considered a mild outlier, and any value less than 10 or greater than 24 may be considered an extreme outlier.
2 and 28 are both extreme outliers.
::分子间值范围为18-16=2. 任何值小于13或大于21的值可被视为温和的外差值,任何值小于10或大于24的值可被视为极端的外差值。 2和28均为极端的外差值。 -
The least value is 2 and the greatest value is 28.
2 is the minimum and 28 is the maximum.
::最低值为2,最高值为28,最低值为28,最低值为28,最高值为28。
Creating Box Plots
::创建框绘图Create box plots representing the data from the first two examples.
::创建代表前两个示例中的数据的框图 。A. The data from 1 was encapsulated in the five number summary:
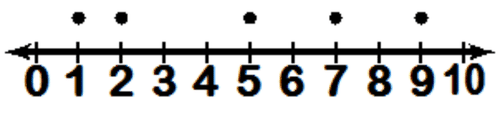
::A. 5个数字摘要概括了1个数据:Median: 5 1 st quartile: 2 3 rd quartile: 7 Minimum: 1 Maximum: 9
::中位数: 5, 1 个四分位数: 2, 3 个四分位数: 7 个最低数: 1 个最大数: 9Draw a number line running from 0 to 10, and plot the five number summary above it:
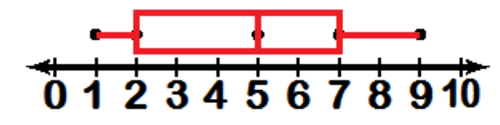
::绘制从 0 到 10 之间的数字行, 绘制上面的五个数字摘要 :Draw a rectangle including the first and third quartiles, and a vertical line for the median. Since there are no outliers, draw a “whisker” from each side of the box to the extremes:
::绘制矩形, 包括第一个和第三个四角形, 以及中位数的垂直线 。 由于没有外部线, 请从框的两侧绘制一个“ 耳机 ” , 到最极端 :B. The data from 2 includes:
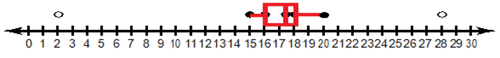
::B. 来自2组的数据包括:Median: 17.5
::中中:17.51 st quartile: 16 3 rd quartile: 18
::第1四分位数: 16; 第3四分位数: 18Minimum: 2 Maximum: 28
::最低值:2个最大值:28个Outliers (extreme): 2, 28
::外部(极端):2,28Draw a number line running from 0 – 30, and plot the five number summary:
::绘制从 0 - 30 运行的编号线, 绘制五个数字摘要 :Note that since “2” and “28” are both extreme outliers, the box-and-whiskers only extend to the greatest and least non-extreme values. This is sometimes called a modified boxplot .
::请注意,由于“ 2” 和“ 28” 两者都是极端的外向值, 盒子和耳机只延伸至最大和最小的非极端值。 这有时被称为“ 修改的框块 ” 。Earlier Problem Revisited
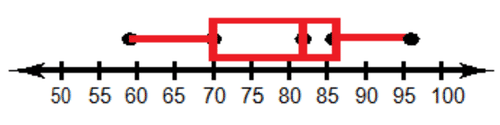
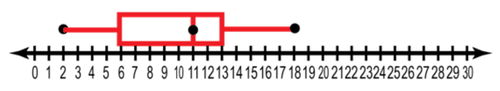
::重审先前的问题If you were asked to create a visual representation of the mean, upper and lower 25% (quartiles), and maximum and minimum (extremes) scores on the final test in your College Algebra class, how would you go about it? Would a box-and-whisker plot be appropriate? Why or why not? What would the plot look like if the mean was 82%, the lowest score was 59%, highest was 96%, and if a quarter of the class scored above 86% while another quarter scored below 70%?
::如果要求您在您的大学代数班的最后考试中创建中值、上值和下值25%(夸蒂尔斯)以及最高值和最小值(极端)分数的直观表示,您将如何进行呢?一个盒子和耳机的图案是否合适?为什么或为什么不合适?如果平均值是82%,最低分是59%,最高分是96%,如果四分之一的班级得分超过86%,而另一季度得分低于70%,这个图案会是什么样子?This would be an excellent application for a box plot. In fact, this is just about the best use of one. You will find, if you haven’t already, that the SAT and ACT college application exams report grades in just his manner. Colleges (and students themselves) inevitably wish to see how a particular score compares to others on the same test, and a box plot is ideal for that purpose.
::这对一个盒式图案来说将是一个很好的应用。 事实上,这只是对盒子图案的最佳利用。 如果还没有,你就会发现SAT和ACT大学应用软件的考试成绩只是以他的方式报告。 学院(和学生本身)不可避免地希望看到某一特定分数在同一个测试中与其他人相比如何,而一个盒子图案是用于这个目的的理想。If the data in the question were plotted as a box plot, it would appear like this:
::如果问题中的数据是作为盒式图案绘制的,那么看来是这样:Examples
::实例Example 1
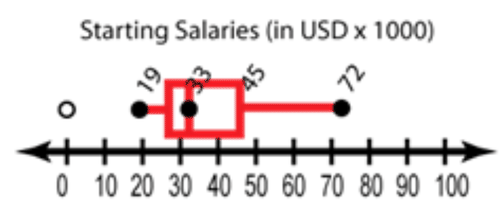
::例1The box-and-whisker plot below shows the starting salaries for graduates of a small college. What is the range of the starting salaries?
::下面的纸箱和口哨图显示了一所小学院毕业生的起薪。起薪的范围是多少?The range is the difference between the maximum and minimum values, that is:
::范围是最大值和最低值之间的差额,即:Example 2
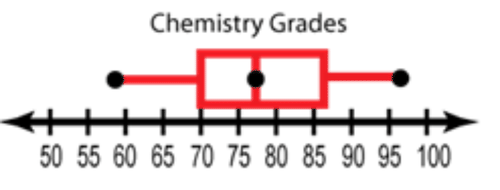
::例2Mr. Andrews made a box-and-whisker graph of the quiz grades in his chemistry class. What is the median quiz grade for the class?
::Andrews先生在他的化学课上 做了一个测验成绩的插盒和插口图。The median is denoted by a line in the center of a boxplot, in this case, that would be 77%.
::中位数用盒式箱式箱式箱中央的一条线表示,在此情况下,中位数为77%。Example 3
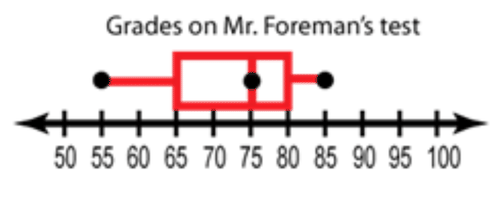
::例3Mr. Foreman grades on a curve in which the top 25% of the test scores earn A’s, the middle 50% earn C’s, and the bottom 25% earn F’s. The box and whisker plot below shows the distribution of scores on the last test. What is the range of scores for people who earned C's?
::Foreman先生的成绩在曲线上,最高25%的考试分数赢得了A,中50%的考试分数赢得了C,而下25%的考试分数赢得了F。 下面的框块和插图显示了上一个考试分数的分布情况。 赢得C的人的分数范围是多少?If the middle 50% of Mr. Foreman’s class earns C’s, then all of the scores in the interquartile range , the area between Q1 and Q3, would be included. Since the “box” of a boxplot indicates the IQR, that would be 65% - 80% .
::如果Foreman先生的中50%的班级收入为C,那么所有在语义范围内的分数,即Q1和Q3之间的地区将被包括在内。 由于一个盒子的“盒子”表示IQR,这意味着智商为65 % - 80%。Review
::回顾Use the following boxplot to answer questions 1 – 5 below:
::使用以下框块回答问题1 - 5:-
What is the median
::中位数 -
What is the lower quartile
::什么是低四分位数 -
What is the upper quartile
::什么是上四分位数 -
What is the minimum value
::什么是最小值 -
What is the maximum value
::什么是最大值 -
What are the five values called?
::五个价值叫什么来着? -
What is the range of the data?
::数据的范围是什么? -
What percentage of the data is below the upper quartile?
::数据中上四分位数以下的百分比是多少? -
What percentage of data is located between the lower quartile and the median?
::下四分位数和中位数之间的数据百分比是多少? -
What percentage of data is above the median?
::高于中位数的数据百分比是多少? -
What percentage of data is below the lower quartile?
::低于下四分位数的数据百分比是多少? -
Calculate the Range for the following data: 5, 21, 10, 9, 12, 12, 16, 16, 9, 6, 20, 8, 10, 26, 4, 26, and 14.
::计算以下数据的范围:5、21、10、9、12、12、16、16、9、6、20、28、10、26、4、26和14。 -
Calculate the First Quartile for the following data: 5, 21, 10, 9, 12, 14, 13, 16, 9, 6, 20, 8, 12, 24, 4, 26, and 14
::计算以下数据的第一个量值: 5, 21, 10, 9, 9, 12, 14, 13, 16, 9, 6, 20, 8, 12, 24, 4, 4, 26, 和 14 -
State the five number summary of the following data set: 13, 14, 10, 4, 18, 17, 11, 10, 5, 7, 10 19, 13
::提供以下数据集的五个数字摘要:13、14、10、4、18、17、11、10、5、7、10、19、13 -
Construct a box and whisker plot for the data set given in question 12
::构造问题12中给定的数据集的框和刻式图
Review (Answers)
::回顾(答复)Click to see the answer key or go to the Table of Contents and click on the Answer Key under the 'Other Versions' option.
::单击可查看答题键, 或转到目录中, 单击“ 其他版本” 选项下的答题键 。 -
The minimum and maximum values – called the
extremes