4.15 解释饼图
章节大纲
-
Kalena’s cheerleading squad is raising money for prom by selling candy at school football games. After a month of sales, the squad is running low on candy and decides to review the sales so far to help them decide what to order when they restock.
::卡莱纳的啦啦队队在学校足球赛中出售糖果,为舞会募集资金。 经过一个月的销售后,球队的糖果销售量越来越少,决定到目前为止再审查销售量,以帮助他们决定何时重新装配。The pie chart below describes the number of sales that the girls have recorded for each item. If you know that they sold 850 fruit popsicles, how could you calculate the number of chocolate bars or bags of lemon drops they sold? We will review this question after the lesson.
::下面的馅饼图表描述了女孩们为每件物品所记录的销售数量,如果你知道她们卖了850个水果冰棒,你如何计算出她们卖出的巧克力棒或柠檬糖袋的数量?在上课后,我们将审查这个问题。Interpreting Pie Charts
::解释派图表Reading a pie chart is relatively simple, which is one of the primary values of a pie chart. The only real trick to it is to become very familiar with the sector angle formula and to practice using it to deduce the value(s) of unspecified data .
::阅读一个派图相对简单,这是一个派图的主要值之一。 它唯一的真正诀窍就是非常熟悉部门角度公式,并用它来推断未指明数据的价值。Recall that each piece of the pie is called a sector, and each sector encompasses an angle that is proportional to the frequency of the data it represents. The formula relating the angle of a sector to frequency is:
::回顾每块馅饼被称为一个部门,每个部门包含一个与其所代表的数据频率成正比的角度。
::扇形 角度 = 样本x360 数据总频率中的数据Because the primary skill here is just familiarity that comes with practice, let’s jump right into the examples.
::因为这里的主要技能只是与实践相伴的熟悉,Interpreting Pie Charts
::解释派图表Given the pie chart below, identify or calculate the following:
::根据下面的馅饼图表,确定或计算如下:a. The total number of tickets to comedy-themed movies
::a. 喜剧主题电影的门票总数To calculate the total number of comedy movie tickets, we need to multiply the decimal equivalent of each of the two comedy categories by the total number of tickets sold to learn how many of each were sold, then find the sum.
::为了计算喜剧电影票的总数,我们需要将两个喜剧类中的每类小数乘以售出的票总数,以了解其中每一类售出多少张,然后找到总和。i.
::i. 21×2070=435浪漫喜剧票j.
::j. 25×2070=518 体制喜剧票k.
::k. 435个浪漫喜剧+518个物理喜剧=953个喜剧总票b. The dollar value of tickets sold to horror movies.
::b. 卖给恐怖电影的票价美元价值。To find the dollar value of the horror movies, first multiply the decimal equivalent of the horror movie percentage, and multiply the result by $7, the price of each ticket.
::为了找到恐怖电影的美元价值, 首先乘以恐怖电影百分比的十进制, 然后乘以每张票的价格7美元。l.
::l. 17×2070=352恐怖电影票m.
::m. 352x7美元=2 464美元恐怖电影票销售额c. The percentage of tickets sold to action and romantic comedies together.
::c. 售给行动和浪漫喜剧的票价百分比。To find the percentage of action and romantic comedy tickets together, simply sum the given percentages.
::为了找到动作和浪漫喜剧票的比例,只需将给定的百分比相加即可。n.
::n. 222133%总动作和浪漫喜剧票Calculating Information Given a Pie Chart
::带有饼图表的计算信息Given the pie chart below, calculate the actual gross sales in years 2001, 2002, 2003, and 2004.
::根据下图,计算2001年、2002年、2003年和2004年的实际销售毛额。Gross sales in 2005 were $94,000
::2005年销售毛额为94 000美元First we need to calculate the total gross sales for all five years. We know that the $94,000 in gross sales from 2005 represents 25% of the total, so we can calculate:
::首先,我们需要计算所有五年的总销售额。 我们知道2005年的94,000美元总销售额占总销售额的25%,因此我们可以计算:
::25x=94,000美元 94,000.25=376,000美元Now we can simply multiply the total gross sales by the percentage represented by each year to get the estimated dollar value for each category:
::现在,我们可以简单地将销售总额乘以每年所占的百分比,得出每一类的估计美元价值:-
2001: 14%
of
$376,000 = $52,640
::2001年:376 000美元中的14%=52 640美元 -
2002: 17%
of
$376,000 = $63,920
::2002年:376 000美元中的17%=63 920美元 -
2003: 21%
of
$376,000 = $78,960
::2003年:376 000美元中的21%=78 960美元 -
2004: 23%
of
$376,000 = $86,480
::2004年:376 000美元中的23%=86 480美元
Verify that the total values add up:
::核实总价值合计:52 640美元+63 920美元+78 960美元+86 480美元+94 000美元=376 000美元Evaluating Pie Charts
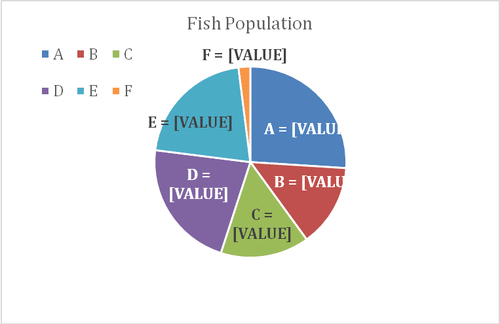
::评估派评估图表Evaluate the pie chart below and answer the questions:
::评估下面的馅饼图表并回答问题:a. If the population of Lake C is 27,000 fish, what is the total fish population of all lakes on the chart?
::a. 如果C湖人口为27 000条鱼类,则图表上所有湖泊的鱼群总数是多少?The population of lake C is 27,000 fish, and represents 15% of the whole, use the data to set up an equation:
::C湖的种群为27 000条鱼类,占全部鱼类的15%,利用这些数据来设定一个方程:
::15x=27 000x=27000.15x=180 000The combined population of all lakes on the chart is 180,000 fish.
::图表上所有湖泊的总人口为18万条鱼类。b. What is the ratio of the fish population in lakes A and C?
::b. A湖和C湖鱼类人口比率是多少?Lake A represents 26% of the total, and Lake C 15%.
::A湖占总数的26%,C湖占15%。The ratio is
::比率为2615=1.73:1c. What is the combined population of lakes D and E?
::c. D湖和E湖的合并人口是多少?Lake D is 22% of 180,000 and Lake E is 21% of 180,000.
::D湖占180,000湖的22%,E湖占180,000湖的21%。Together they represent 22% + 21% = 43% of the total.
::它们合起来占总数的22%+21%=43%。fish in lakes D and E together.
::43180,000=77,400 鱼类在D湖和E湖中合在一起。Earlier Problem Revisited
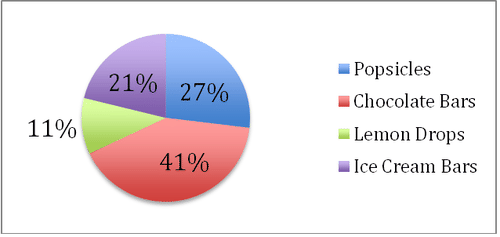
::重审先前的问题The pie chart below describes the sales that the girls have recorded as numbers of sales. If you know that they sold 850 fruit popsicles, how could you calculate the number of chocolate bars or bags of lemon drops they sold?
::下面的馅饼图表描述了女孩们所记录的销售数量,如果你知道她们卖了850个水果冰棒,你如何计算出她们卖的巧克力棒或柠檬糖袋的数量?
This one should be a piece of… pie… now! 850 fruit popsicles represents 27% of the total. Set up an equation:
::这应该是一块... 馅饼... 现在! 850个水果冰棒 占到总数的27%。
::27%x=850x=850.273148销售总额Chocolate Bars represent 41% of the 3,148 total sales:
::巧克力酒吧占总销售额3 148美元的41%:
::41x3148=1291巧克力棒Lemon Drops represent 11% of the 3,148 sales:
::Lemon Drops占3,148销售额的11%:
::11×3148=346柠檬滴袋Examples
::实例The two charts below show the distribution of overseas tourist traffic from Europe to other countries. They show the distribution by country and by age, respectively.
::以下两个图表显示了从欧洲到其他国家的海外旅游流量分布情况,分别按国家和年龄分列。Example 1
::例1What percentage of tourists went to either the US or Australia?
::前往美国或澳洲的游客比例是多少?We can see from the top chart that U.S. travelers (in blue) accounted for 40% of the travel, and Australian travelers (green) represented 10%. The total percentage who went to either country is of travelers.
::从上图可以看出,美国旅行者(蓝色)占旅行人数的40%,澳大利亚旅行者(绿色)占10%。 前往任一国家的总比例是旅行者的40-10-50%。Example 2
::例2What is the ratio of European tourists that went to the USA to the number of European tourists who were below the age of 30?
::前往美国的欧洲游客与不足30岁的欧洲游客的比例是多少?40% of travelers went to the U.S, and 15% were under 30 (bottom graph, in red). The ratio is 40:15 or 8:3.
::40%的旅行者前往美国,15%不到30岁(图表底部,红色)。 比例为40:15或8:3。Example 3
::例3If, among the "other destinations", India accounted for 25% of the travel, and it is known that 25 Europeans went to India, how many 30-39 year old Europeans went abroad in that year?
::如果在“其他目的地”中,印度占旅行的25%,而且已知有25名欧洲人去了印度,那年有多少30至39岁的欧洲人出国?If India accounts for 25% of the 20% of travelers who went to “other destinations”, then it accounts for 5% of the total travelers . If 25 Europeans went to India, then we know 25 travelers represents 5% of the total. We can calculate the total number of European travelers to be: . We then look at the Age of Travelers chart and see that 30-39 year olds accounted for 15% of the travel that year. Multiply 15% by 500 to find our answer, which is 75 travelers .
::如果印度占到“其他目的地”旅行者20%的25%,那么占旅行者总数的5%(25205 % ) 。如果25个欧洲人去了印度,那么我们就知道25个旅行者占到总数的5%。我们可以计算出欧洲旅行者总数:5x=25x=25.05x=500。然后我们查看旅行者年龄图,看30-39岁的人占到当年旅行的15%。乘以15%乘以500来找到答案,即75个旅行者。Example 4
::例4Based on the data, about how many 40-49 year olds traveled to Japan?
::根据数据, 有多少40-49岁的人 前往日本?We know there are a total of 500 travelers. We can look at the number of total travelers who went to Japan, which is 30% of the 500, or 150 people who went to Japan . Out of that 150, we can guess that 20% (the percentage of 40-49 year old travelers, from the bottom chart) of them were between the age of 40-49. people.
::我们知道共有500名旅行者。我们可以看一看去日本的旅行者总数,即500人中的30%,或150人。 在这150人中,我们可以猜到其中20%(从底图看,40-49岁旅行者的百分比)在40-49岁之间。 20150=30人。Review
::回顾The following pie-chart shows the percentage distribution of the expenses incurred in publishing a statistics math book. Study the Pie Chart and answer the questions below.
::以下派图显示了出版统计数学书籍所涉费用的百分比分布情况。研究《派图》并回答下列问题。1. If the publisher paid $30,600 for printing, then how much did the publisher pay the author to write the book?
::1. 如果出版商支付30,600美元的印刷费,那么出版商付给提交人多少钱来写书?2. What is the measurement of the angle of the sector that corresponds to the authoring expense?
::2. 部门角度与承付费用相对应的衡量尺度是什么?3. If the book is sold at 20% above the actual cost per book, and the marked price is $180.00, what is the cost of the paper used in a single copy of the book?
::3. 如果这本书的售价比每本书的实际成本高出20%,而且标价为180.00美元,那么一本书中使用的纸的成本是多少?4. If 5500 copies of the book are published, and shipping on them amounts to $82,500, what should the selling price of the book be so that the publisher can earn a profit of 25%?
::4. 如果出版5 500本该书,运输价值达82 500美元,那么该书的销售价格应该如何,使出版商能够赚取25%的利润?5. Authorship of the book is less than the printing cost by what percentage?
::5. 书的作者比例低于印刷成本多少百分比?6. If the difference between two of the expenditures in the chart are represented by 54 degrees, then which combination(s) of two expenditures could they be?
::6. 如果图表中两个支出之间的差额为54度,那么两种支出的哪一种组合?7. If the cost of paper is $56,250 for printing an edition of the book, then what was the advertising cost?
::7. 如果印刷一本书的纸张费用为56 250美元,那么广告费用是多少?8. Identify two expenditures that together have a central angle of 108 degrees.
::8. 查明两个支出,这两个支出的中央角度为108度。The following pie chart shows the sources of funds that will be collected by Downtown Development to beautify the city. Use the chart to answer the questions that follow.
::下面的派图显示了下城开发公司为美化该城市而收集的资金来源。使用图解回答下面的问题。9. Nearly 20% of the funding will come from which source? 55290
::9. 近20%的资金来自哪个来源? 5529010. If the city could only pull $9,725 from bonds, by what percent should it increase the amount it borrows against its investments to make up the difference?
::10. 如果该城市只能从债券中提取9 725美元,那么它应该用多少百分比来增加借款额,以弥补差额。11. If the bonds are managed by a third party that collects a 10% commission, how much would the bonds have actually been worth, before being added to the budget represented in the chart above?
::11. 如果债券由收取10%佣金的第三方管理,债券的实际价值是多少,然后才计入上图所列预算?12. What is the degree measure corresponding to the Taxes collected?
::12. 与征收的税款相应的程度衡量尺度是什么?13. What is the approximate ratio of the funds to be collected through Bonds and through City Investments?
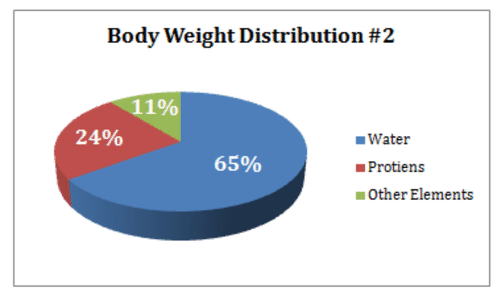
::13. 通过债券和通过城市投资筹集的资金的大致比率是多少?The following charts give information about how weight is distributed throughout the human body, according to different components. Answer the questions below based on the pie charts.
::以下图表按不同组成部分说明人体重量如何分布。根据饼饼图回答下面的问题。
14. What percentage of proteins is equivalent to the weight of skin?
::14. 蛋白质中相当于皮肤重量的百分比是多少?15. How much of the human body is neither made of bones or skin?
::15. 人体的多少不是用骨头或皮肤制造的?16. What is the ratio of the weight of proteins in the muscles to that of the weight of proteins in the bones?
::16. 肌肉蛋白质重量与骨头蛋白质重量之比是多少?Review (Answers)
::回顾(答复)Click to see the answer key or go to the Table of Contents and click on the Answer Key under the 'Other Versions' option.
::单击可查看答题键, 或转到目录中, 单击“ 其他版本” 选项下的答题键 。 -
2001: 14%
of
$376,000 = $52,640