5.7 不同做法
章节大纲
-
Suppose you were given a histogram and asked to find the variance of the data it illustrates? Would you know how?
::假设你得到一个直方图 并被要求找出 数据的差异 它所显示的数据? 你知道如何?After this lesson, you will understand how to compare visualized data with variance.
::在此课后, 您将了解如何比较可视化数据与差异 。
Comparing Visualized Data with Variance
::将可视数据与差异进行比较Knowing how to calculate the variance of a set when it is given to you as a list of values is great, but statistical data is often shared and disseminated in visual form rather than as raw data . Because of this, it is important to practice evaluating the variance of graphed data as well as tabular or raw data so you can actually apply your understanding of variance to real-world statistics .
::当作为数值列表提供给您时,知道如何计算一组变量的差异是巨大的,但统计数据通常以视觉形式而不是原始数据来共享和传播。 因此,必须用实践来评价图表化数据以及表格或原始数据的差异,以便您能够实际将您对差异的理解应用到真实世界的统计数据中。In general, you will need to:
::一般而言,你需要:-
Identify the values of the dependent
variable
, as these are the values you will be finding the variance of.
::标明依赖变量的值,因为这些是您将发现的差异值。 -
Sum the values and calculate the
arithmetic mean
.
::计算数值并计算算术平均值。 -
Subtract the mean from each value to find the
deviation
and square the deviation
::从每个值中减去平均值以找到偏差和偏差平方 -
Sum the squared deviations and divide the total by the count of values in the
data set
, the result is the variance.
::平方差和总数除以数据集中的数值,结果为差异。
Finding the Mean and Variance
::查找平均值和差异Find the and of the number of students in each classroom at Toni’s school:
::找到托尼学校每个教室学生人数的微秒和秒秒2:Classroom Number of Students A 6 B 5 C 9 D 13 E 12 F 16 G 14 Follow the steps from above to find mean and variance of the students:
::从上到下,寻找学生的中差:1. The frequency of students in each classroom is the dependent variable.
::1. 每个教室学生的频率是依附变量。2. There are 7 values, listed in ascending order they are: 5, 6, 9, 12, 13, 14, and 16.
::2. 有7个数值,按上升顺序列出:5、6、9、12、13、14和16。3. The sum of the values is: , the mean is .
::3. 数值之和为:5+6+9+12+13+14+16=75,平均值为757=10.714。4. The deviances and squared deviances are:
::4. 偏差和正方差是:32.65 22.22 2.94 1.654 5.226 10.798 27.942 5. The sum of the squared deviances is 103.43. The variance is
::5. 平方偏差之和为103.43,差额为103.437=14.776Finding the Mean and Variance of Graphed Data
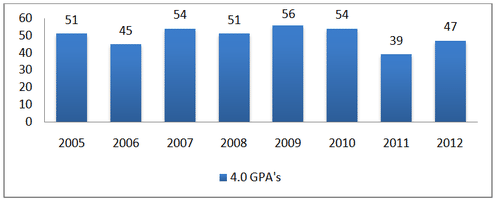
::查找图表数据的平均和差异Find the and of the graphed data.
::查找图形化数据的 μ和 □12 。Follow the steps outlined above:
::遵循上述步骤:1. Most often, the dependent variable is represented by the vertical axis, and this histogram is no exception. The number of 4.0’s each year is the dependent variable, while the year is the independent variable.
::1. 多数情况下,依附变量由垂直轴表示,这一直方图也不例外,每年4.0个数字是依附变量,而该年是独立变量。2. In ascending order, the dependent variable values are:
::2. 按升序排列,依附变量值为:3. The sum of the values is: .
::3. 数值的总和是:39+45+47+51+51+54+54+56=397。The mean (μ) is: which suggests that a year with 50 or more 4.0 GPA’s would be considered an above average year.
::平均值(微克)是:3978=49.625,这意味着50个或以上GPA的年份将被视为超过平均年数的一年。4. The deviation and squared deviation of each value is:
::4. 每种数值的偏差和平方偏差如下:Deviance Deviance 2 5. The sum of the squared deviances is 334.87, making the variance .
::5. 平方差价之和为334.87,因此差额为334.878=41.86。Interpreting Frequency Polygons
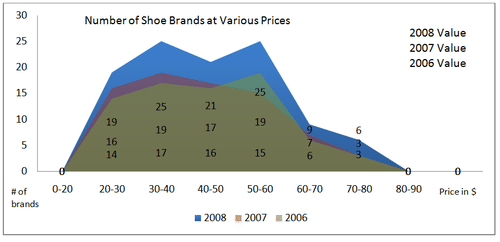
::解释频率多边形Based on the data in the frequency polygon , which year had the greatest variance in number of shoe brands at various prices, and which had the least variance?
::根据频率多边形的数据,哪一年以各种价格计算的鞋品牌数量差异最大,哪些差异最小?Each of the three data sets contains 6 values, and the mean of each set is:
::三个数据集中每个数据集包含6个值,每个数据集的平均值是:-
2008:
Sum
:
Mean
:
::2008年:总和:19+25+21+25+9+6=105迈恩:1056=17.5 -
2007:
Sum
:
Mean
:
::2007年:总和:16+19+17+19+7+3=81 -
2006:
Sum
:
Mean
:
::2006年:总数:14+17+16+15+6+3=71
The sum of the squared deviances for each year is:
::每年的平方差幅总和是:- 2008:
- 2007:
- 2006:
The variance of each set is:
::每套费用的差异如下:- 2008:
- 2007:
- 2006:
2008 has the greatest variance and 2006 has the least variance
::*2008年差异最大,2006年差异最小Earlier Problem Revisited
::重审先前的问题Could you find the presented as a histogram?
::你能找到显示的直方图吗?After your practice above, this should no longer be a problem!
::在你以前练习过之后,这应该不再是问题了!Examples
::实例The number of cars of various colors in a parking lot with 5 levels is summarized by the table below, use the data to answer questions 1-4.
::下表汇总了停车场5层不同颜色的汽车数量,用数据回答问题1-4。Red Yellow Blue White Level 1 11 4 9 14 Level 2 9 3 8 11 Level 3 13 5 10 12 Level 4 14 4 7 9 Level 5 12 6 13 7 Example 1
::例1What is the variance of red cars among the 5 levels?
::红色汽车在5级之间有什么差异?The population of red cars across the 5 levels is: 11, 9, 13, 14, and 12.
::5级的红色汽车人口为:11、9、13、14和12。-
Add the values and divide by five to get the mean of 11.8.
::加上数值和除法乘以5,得出11.8的平均值。 -
Square each of the values and sum the squares:
::每个数值的平方和平方之和:112+92+132+142+122+122=711 -
Divide the sum of the squares by the number of values in the set (since this is the whole population of red cars), getting
, and subtract the mean squared
::平方之和除以数据集中的数值数(因为这是红色汽车的总数),取7115=142.2,减去平均值(11.82=139.24) -
The variance of the population of red cars is
::红色汽车的人口差异为142.2-139.24=2.96。
Example 2
::例2What is the color variance of blue cars across the 5 levels?
::蓝色汽车在5级的颜色差异是什么?The levels above level 3 include only levels 4 and 5. The total number of red, yellow, blue, and white cars is 26, 10, 20, and 16, respectively.
::3级以上仅包括4级和5级,红色、黄色、蓝色和白色汽车的总数分别为26、10、20和16。-
The mean number of cars of each color is
::每个颜色的汽车平均数量为 26+10+20+164=18 -
Square the values and find the sum:
::平方值,然后找到总和:262+102+202+162+1432 -
Divide the sum of the squares by the number of values:
. Subtract the squared mean
to get the variance:
::将平方之和除以数值数:14324=358。 减去平方平均值(182=324)以得出差数:358-324=34。
Example 3
::例3What is the variance of blue cars across the 5 levels?
::蓝色汽车在5级之间有什么差异?The blue car counts are: 9, 8, 10, 7, and 13
::蓝色汽车计数为: 9 8 10 7 和 13-
The mean number of blue cars is
::蓝色汽车的平均数为475=9.4。 -
The sum of the squared values is
, divided by the number of levels (5), gives us 92.6
::平方数值之和为92+82+102+102+72+132+132=463,除以等级数(5),让我们得出92.6。 -
Subtract the squared mean
to get the variance
::减去平方平均值(9.42=88.36)以得出差异 -
The variance is
::差额为92.6-88.36=4.24。
Example 4
::例4If we take a sample of levels by rolling a die and end up with levels 1, 3, and 5, what is the variance of white cars in the sampe?
::如果我们通过滚动死亡来抽样检查水平, 最终达到1级、3级和5级,The number of white cars on levels 1, 3, and 5 is 14, 12, and 7.
::1层、3层和5层的白色汽车数量是14层、12层和7层。-
The mean number of white cars in this sample is
::本样本中白色汽车的平均数量为333=11 -
Since this is a sample, we need to use the individual deviations:
subtract the mean from each value, and square the result of each subtraction, then find the sum:
::由于这是抽样,我们需要使用个别偏差:减去每个数值的平均值,每减法结果平方,然后找到总和(14-11)、2+(12-11)、2+(7-11)2+(7-11)2=26 -
Divide the sum of the deviations by the number of values
minus 1
(remember, this is a sample!):
::将偏差之和除以数值数减去1(记得,这是个样本!):262=13 -
The
sample variance
is 13.
::抽样差异为13。
Review
::回顾Find the variance:
::查找差异 :1. 365, 400.7, 303, 479, 514.2, 500, 489
2. 7200, 7020, 7165.9, 7000, 7796, 7012, 7016.1
3. 17, 10.3, 30.7, 70, 66, 76, 40, 53
4. 3607, 3600, 3600, 3631, 3600.6
5. 700, 700, 712, 756, 741, 716, 782
6. 3370, 3300.5, 3366, 3306.6, 3310, 3336, 3301.3
Calculate the sample variance:
::计算抽样差异:7. 34.4, 34, 34.7, 34.6, 34, 34.1, 31, 31.3
8. 989.22, 990.6, 992, 996.9, 981.1, 986, 975
9. 10, 16, 10.33, 10.63, 18, 17, 16.36, 10.46
10. 3240, 3260, 3250, 3280, 3280, 3300, 3310, 3270
Review (Answers)
::回顾(答复)Click to see the answer key or go to the Table of Contents and click on the Answer Key under the 'Other Versions' option.
::单击可查看答题键, 或转到目录中, 单击“ 其他版本” 选项下的答题键 。 -
Identify the values of the dependent
variable
, as these are the values you will be finding the variance of.