7.5 概率密度函数
章节大纲
-
Bar graphs and histograms are great for visualizing the probability distributions of discrete random variables , but neither of those are appropriate for continuous random variables , since there would need to be an infinite number of bins or columns to represent the possible outcomes. How then do we visualize the probability of a continuous random variable ?
::条形图和直方图对可视化离散随机变量的概率分布非常有益,但两者都不适合连续随机变量,因为需要无限数量的文件夹或列来代表可能的结果。 那么我们如何想象出连续随机变量的概率呢?Probability Density Functions
::概率密度函数When it comes to describing the probability of a particular value of a random variable, there is one particularly huge difference between discrete and continuous variables :
::在描述随机变量特定值的概率时,离散变量和连续变量之间有一个特别巨大的差异:-
The probability that a continuous random variable will take on a particular value is, for all intents and purposes,
always zero
. Therefore, we calculate the probability that the variable will take on a particular value within a
range
of values.
::连续随机变量对特定值的概率,就所有意图和目的而言,始终为零。因此,我们计算该变量对特定值的概率。 -
The probability that a discrete random variable will take on a particular value can be calculated for that value.
::一个离散随机变量对特定值的概率,可以据此值计算出来。
Perhaps the most immediately obvious result of this difference in the two types of variables appears in the way we visualize the probability distribution of each:
::也许这两类变数的这种差异最直接明显的结果 出现在我们想象每个变数的概率分布的方式上:-
Discrete Random Variable
: A
bar chart
or
histogram
illustrating the probability that a discrete random variable will take on a particular value is straightforward: the height of the bar represents the probability that the variable will take on the value represented by the bar. In the example below, we have a
bar graph
from a previous lesson showing the probability distribution of rolling two dice. We can see by looking at the graph that the probability that the two dice will total seven is between 15% and 20% (the actual value is apx 16.7%). The number of possible outcomes is specific and limited, and it is clear that if we were to roll the two dice, we would expect to see exactly seven pips relatively often.
::分辨随机变量:用条形图或直方图显示离散随机变量对特定值的概率是直截了当的:条形的高度代表该变量对巴形表示的数值的概率。在下面的例子中,我们有一个前一课的条形图显示滚动两个骰子的概率分布。通过查看该图,我们可以看到两个骰子共七分之一的概率在15%到20%之间(实际值是apx 16.7%)。可能的结果数量是具体的和有限的,而且很明显,如果我们滚动两个骰子,我们预计会比较经常看到七分之一。
-
Continuous Random Variable:
A continuous random variable does not represent a specific or countable number of outcomes. Between any two values of a continuous variable, there are always more values. Because of this, we cannot visualize the distribution of probabilities with bars, since there is no way to create a bar for each possible value of the variable. The solution is to use a graph to identify the probability that a particular value we are interested in will occur within a range of values. This graph, called a
probability density
graph, illustrates that probability as the area under a portion of a curve like the
normal curve
below.
::连续随机变量 : 连续随机变量不代表一个特定或可计算的结果数。 在连续变量的任何两个值之间, 总是有更多的值。 因此, 我们无法想象用条形线来分配概率, 因为无法为变量的每一种可能值创建条条。 解决方案是使用一个图形来确定我们感兴趣的特定值在数值范围内发生的概率。 这个图形称为概率密度图形, 将概率显示为曲线下方的某个部分, 如下方的正常曲线 。
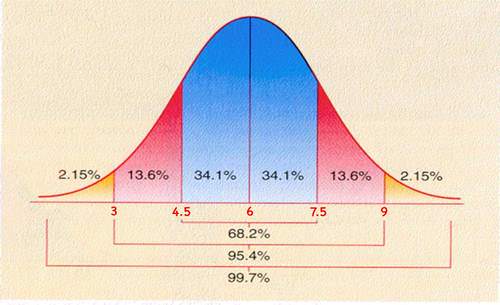
This probability density graph is a representation of a normal curve , which will be spending more time on later. For now we use it to learn how a probability density graph works.
::此概率密度图是一个普通曲线的表示, 通常曲线会花更多的时间在以后。 现在我们用它来学习概率密度图是如何工作的 。The center of the graph is the tallest point, and represents the mean of the data . Each of the colors in this image represent one standard deviation (sort of a standard ‘step size’ – we will discuss this more later) from the mean. The percentages marked on the image describe the probability that a random selection from the data represented on the graph will fall within that range.
::图形的中心是最高点, 并代表了数据的平均值 。 此图像中的每个颜色代表一个标准偏差( 标准“ 步数大小 ” ( step size ) ) ( 标准“ 步数 ” 数 ) , 稍后再讨论 ) 。 图像上标注的百分数描述了从图形上显示的数据中随机选取的概率是否属于此范围 。Calculating Probability
::计算概率1. What is the probability that a random value selected from the normal graph below will be between 3 and 9?
::1. 从下方普通图中选择的随机值在3至9之间的可能性有多大?According to the graph, the mean of the data is 6, and the standard deviation is 1.5. We can see from the color-coding that the area between two standard deviations below and 2 standard deviations above the mean represents a probability of 95.4%.
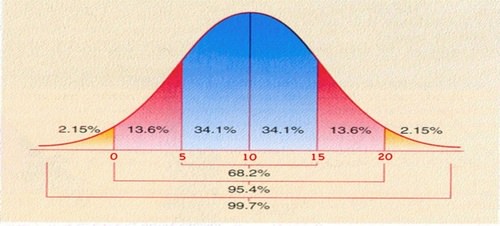
::根据图表,数据平均值为6,标准偏差为1.5。我们从颜色编码中可以看出,低于2个标准偏差和高于平均值2个标准偏差之间的区域概率为95.4%。2. Look at the image below, where we have a normal curve with a mean of 10, and a standard deviation of 5. What is the probability that a randomly chosen value from the function illustrated will be between 5 and 15?
::2. 看看下面的图像,我们有一个正常曲线,平均值为10,标准偏差为5。 从所显示的函数中随机选择的值在5到15之间的可能性有多大?As you can see by the area colored blue, there is a 68.2% probability that a value within 5 units of 10 will occur. So there is approximately a two-thirds probability that a random value selected from the data will be between 5 and 15.
::从蓝色区域可以看出,5个单位内值为10的概率为68.2%。 因此,从数据中选择的随机值在5到15之间的概率约为三分之二。Looking at the Normal Curve
::查看正常曲线Use the image of the normal curve below to answer questions a-c:
::使用下方正常曲线的图像回答问题a-c:a. How much of the area under the curve below is located to the left of the mean?
::a. 曲线下下方多少区域位于平均值左边?On a normal curve, the is the same as the mode, which is the center of the graph. Since the center is the median, one-half of the data is to the left, and one-half to the right.
::在普通曲线上,该曲线与图的中心模式相同。由于中心是中位数,数据的一半在左边,另一半在右边。b. How much of the total area is located to the right of +1 standard deviation?
::b. +1标准偏差权占总面积的多少?The entire graph is 100% of the data, and half of it is to the left of the median. One standard deviation incorporates another 34.1%, so the total area to the left of the +1 standard deviation mark would be . The area to the right of the mark is .
::整张图是数据的100%, 其中一半是中位数左边。 一条标准偏差包含另外34.1%, 因此, +1 标准偏差点左侧的总面积将是 50 34.184.1%。 标记右侧的面积是 100 84.115.9 % 。c. How much area is located to the left of +2 standard deviations?
::c. +2标准偏差左侧有多少区域?The area below two SD’s above the mean would incorporate the 50% below the median, plus the 34.1% between the median and +1 SD, plus the 13.6% between +1 SD and +2 SD’s = 97.7%.
::中位数和+1 SD之间加34.1%,加+1 SD与+2 SD=97.7%之间的13.6%。Earlier Question Revisited
::先前重审的问题Bar graphs and histograms are great for visualizing the probability distributions of discrete random variables, but neither of those are appropriate for continuous random variables, since there would need to be an infinite number of bins or columns to represent the possible outcomes. How then do we visualize the probability of a continuous random variable?
::条形图和直方图对可视化离散随机变量的概率分布非常有益,但两者都不适合连续随机变量,因为需要无限数量的文件夹或列来代表可能的结果。 那么我们如何想象出连续随机变量的概率呢?Since the probability of randomly choosing an exact value in a given interval is essentially zero, we calculate the probability of randomly choosing a value in a given interval. We graph the trends of the probability as a smooth curve, and calculate the probability that a value will lie within a particular interval as the area between the smooth curve and the -axis on a Cartesian graph.Vocabulary
::由于在给定的间隔中随机选择准确值的概率基本上是零,我们计算在给定间隔中随机选择值的概率。我们将概率的趋势作为光滑曲线绘制,并计算一个数值在某个间隔内的可能性,即平滑曲线和笛卡尔图中的 x 轴之间的区域。Examples
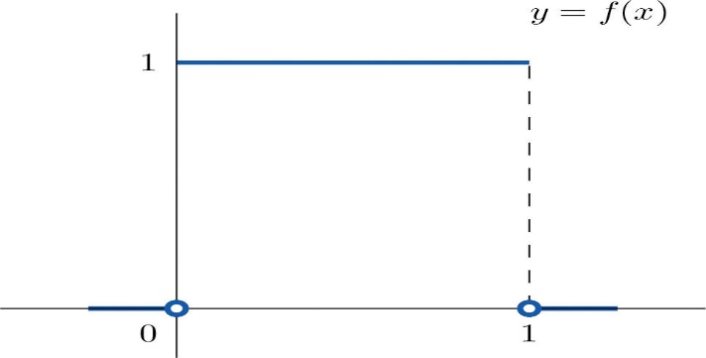
::实例Use the graph of the uniform distribution (all values in the range have the same probability of occurring) below to answer questions 1-3:
::为回答问题1-3,请使用以下统一分布图(该范围内的所有数值发生概率相同)来解答问题1-3:Example 1
::例1Find , the probability that will be between 0 and 1.
::查找 P( 0 < x < 1) , X 在 0 到 1 之间的概率 。Recall that the probability that a value will occur within a given range is represented by the area between the defining line and the -axis. Since the interval is 0 to 1, and the defining line is parallel to the -axis and 1 unit above the -axis, the area is a rectangle and can be calculated as . Therefore .
::提醒注意一个数值在给定范围内发生的概率是以定义线和X轴之间的区域表示的。由于定义线的间隔为0至1,而定义线与X轴以上X轴和1个单位平行,因此,这个区域是一个矩形,可以以xxwidth=1x1=1 sq单位计算。因此,P(0 <X<1)=1或100%。Example 2
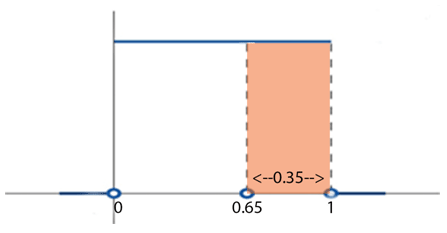
::例2Find , the probability that will be greater than 0.65.
::查找 P(X>0.65), X 大于 0.65 的概率。(See the image) If , then the width of the area is . The height is 1 unit, so the area is . Therefore .
::如果 X>0.65, 区域宽度为 1-0.65=0. 35。 高度为 1 单位, 区域为 1x0. 35=0. 35 平方米。 因此, P( X>0. 65) = 35 或 35% 。Example 3
::例3Find , the probability that will be less than 0.40
::查找(X<.40),X的概率小于0.40If , then the width of the area representing the probability is .40. Since the height is still 1, the area is . Therefore .
::如果 X < / 40,则代表概率的区域宽度为 . 40。由于高度仍为 1, 则区域为 0.40x1= 0.40 sq 单位。 因此, P(X) < 0. 40 = 40% 或 40% 。Review
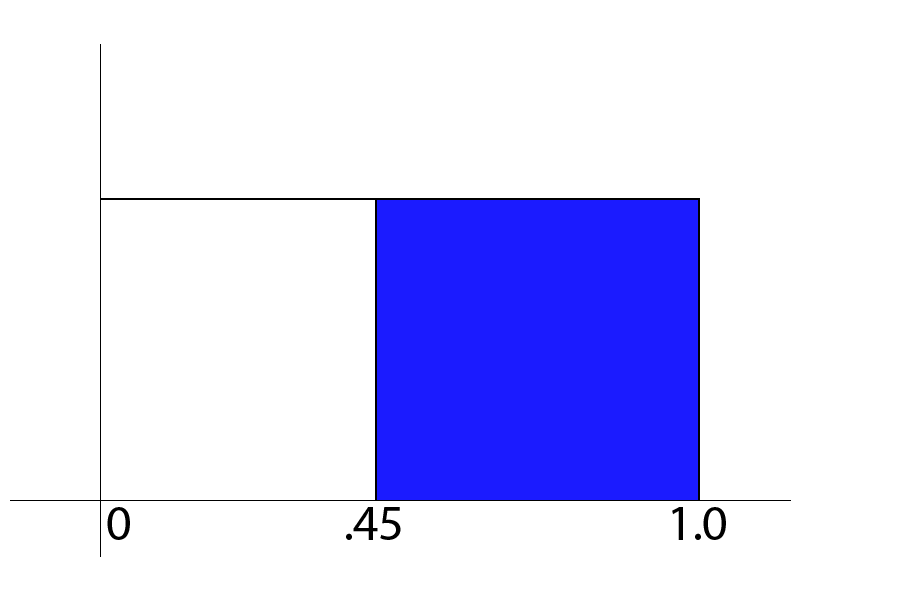
::回顾The graph below illustrates the probability distribution of random variable , use it to calculate the answers to problems 1-4:
::下图显示随机变量Y的概率分布,用它来计算问题1-4的答案:1. What is ?
::1. 什么是P(Y >.45)?2. What is ?
::2. 什么是P(Y>0)?3. What is ?
::3. 什么是P(Y <.45)?4. What is ?
::4. 什么是P(Y>1)?The graph below illustrates the uniform probability distribution of random variable , use it to calculate the answers to problems 5-8:
::下图说明随机变数Z的统一概率分布,用它来计算问题5-8的答案:5. What is ?
::5. 什么是P(.27)?6. What is ?
::6. 什么是P(0)?7. What is ?
::7. 什么是P(.27)?8. What is ?
::8. 什么是P(1)?The graph below illustrates the normal probability distribution of random variable A , use it to calculate the answers to problems 9-15:
::下图说明随机变数A的正常概率分布,用它来计算问题9-15的答案:9. What is ?
::9. 什么是P(6.5<A<19.5)?10. What is ?
::10. 什么是P(0<A<19.5)?11. What is ?
::11. 什么是P(0<A)?12. What is ?
::12. 什么是P(A<26)?13. What is ?
::13. 什么是P(-6.5<A<0)?14. What is ?
::14. 什么是P(32.5<A)?15. What is ?
::15. 什么是P(A=13)?Review (Answers)
::回顾(答复)Click to see the answer key or go to the Table of Contents and click on the Answer Key under the 'Other Versions' option.
::单击可查看答题键, 或转到目录中, 单击“ 其他版本” 选项下的答题键 。 -
The probability that a continuous random variable will take on a particular value is, for all intents and purposes,
always zero
. Therefore, we calculate the probability that the variable will take on a particular value within a
range
of values.