9.1 了解正常分配
章节大纲
-

If you knew that the prices of t-shirts sold in an online shopping site were normally distributed , and had a mean cost of $10, with a standard deviation of $1.50, how could that information benefit you as you are looking at various t-shirt prices on the site? How could you use what you know if you were looking to make a profit by purchasing unusually inexpensive shirts to resell at prices that are more common?
::如果你知道在网上购物网站出售的T恤衫的价格通常被分配,而且平均价格为10美元,标准差为1.50美元,那么,当你看到网上各种T恤衫的价格时,这些信息又如何对你有利?如果你想要通过购买价格特别低廉的衬衫来转售价格更常见的衬衫来获利,你怎么能使用你所知道的东西呢?The Normal Distribution
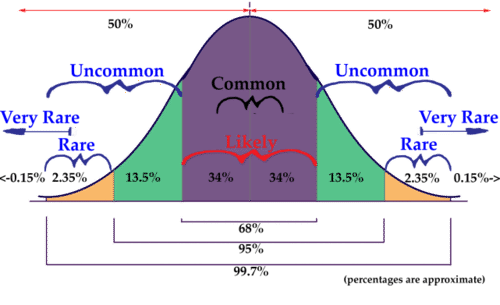
::正常分配A distribution is an evaluation of the way that points in a data set are clustered or spread across their range of values. A normal distribution is a very specific symmetrical distribution that indicates, among other things, that exactly of the data is below the mean, and is above, that approximately 68% of the data is within 1, approximately 96% of the data is within 2, and approximately 99.7% is within 3 standard deviations of the mean.
::分布是评价数据集中各点在数值范围内的组合或分布方式。 正常分布是一种非常具体的对称分布,除其他外,它表明12项数据完全低于平均值,12项数据高于平均值,大约68%的数据在1之内,大约96%的数据在2之内,大约99.7%在平均值的3个标准差之内。There are a number of reasons that it is important to become familiar with the normal distribution, as you will discover throughout this chapter. Examples of values associated with normal distribution:
::有一些原因表明,必须熟悉正常分布,正如你在整个本章中将发现的那样。-
Physical characteristics such as height, weight, arm or leg length, etc.
::身高、体重、胳膊或腿长等物理特征。 -
The
percentile
rankings of standardized testing such as the ACT and SAT
::ACT和SAT等标准化测试的百分数排名,如ACT和SAT -
The volume of water produced by a river on a monthly or yearly basis
::河流每月或每年产生的水量 -
The velocity of molecules in an ideal gas
::理想气体中分子的速度
Knowing that the values in a set are exactly or approximately normally distributed allows you to get a feel for how common a particular value might be in that set. Because the values of a normal distribution are predictably clustered around the mean, you can estimate in short order the rarity of a given value in the set. In our upcoming lesson on the , you will see that it is worth memorizing that normally distributed data has the characteristics mentioned above:
::了解一组中值的分布是准确或大致正常的, 使您能够感觉到该组中特定值的共性。 由于正常分布值可以预测地围绕平均值分组, 您可以快速估计集中给定值的稀有性。 在即将开始的关于该组的课程中, 您可以看到, 值得记住的是, 通常分布的数据具有上述特性 :-
50% of all data points are above the mean and 50% are below
::50%的所有数据点高于平均数,50%低于平均数 -
Apx 68% of all data points are within 1 standard deviation of the mean
::68%的所有数据点的Apx 68%在平均值的1个标准差以内 -
Apx 95% of all data points are within 2 standard deviations of the mean
::95%的所有数据点的Apx 95%在平均值的2个标准偏差之内 -
Apx 99.7% of all data points are within 3 standard deviations of the mean
::99.7%的所有数据点都低于平均值的3个标准差
In this lesson, we will be practicing a ‘rough estimate’ of the probability that a value within a given range will occur in a particular set of data, just to develop an intuition of the use of a normal distribution. In subsequent lessons, we will become more specific with our estimates. The image below will be used in greater detail in the lesson on the Empirical Rule, but you may use it as a reference for this lesson also.
::在这个教训中,我们将用“粗略估计”来判断某个特定范围内的数值在特定数据集中出现的可能性,仅仅是为了形成使用正常分布的直觉。 在接下来的教训中,我们将更加具体地使用我们的估计。下面的图像将在经验规则的教训中更详细地使用,但你也可以用它作为这一教训的参考。Understanding the Normal Distribution
::了解正常分发情况1. Human height is commonly considered an approximately normally distributed measure. If the mean height of a male adult in the U.S.A. is 5′10″, with a standard deviation of 1.5″, how common are men with heights greater than 6′2″?
::1. 人身高通常被视为大致正常分布的尺度,如果美国成年男子的平均身高为510,标准偏差为1.5,身高大于622的男子有多常见?Since each standard deviation of this normally distributed data is 1.5″, and 6′2″ is 4″ above the mean for the population , 6′2″ is nearly 3 standard deviations above the mean. That tells us that men taller than 6′2″ are quite rare in this population.
::由于通常分发的数据的每个标准偏差是1.5, 6244高于人口平均数, 62几乎比平均数高出3个标准偏差。 这表明男性的比626的位数在这个人口中相当少见。2. If the fuel mileage of a particular model of car is normally distributed, with a mean of 26 mpg and a standard deviation of 2 mpg, how common are cars with a fuel efficiency of 24 to 25 mpg?
::2. 如果某一型号汽车的燃料里程通常分配,平均为26 mpg,标准偏差为2 mpg, 燃料效率为24至25 mpg的汽车有多常见? We know that apx 68% of the cars in the population have an efficiency of between 24 and 28 mpg, since that would be 1 SD below and 1 SD above the mean. That suggests that apx 34% have an efficiency of 24 to 26 mpg, so we can say that it is uncommon to see a car with an efficiency between 24 and 25 mpg, but not extremely so.
::我们知道,68%的汽车在人群中的效率在24到28 mpg之间,因为这意味着1SD低于平均水平,1SD高于平均值。 这表明34%的apx 34%的效能为24到26 mpg,因此我们可以说,看到一辆车在24到25 mpg之间,效率在24到25 mpg之间,这是罕见的,但情况并非如此。3. If the maximum jumping height of U.S. high school high jumpers is normally distributed with a mean of 5′11.5″ and a SD of 2.2″, how unusual is it to see a high school jumper clear 6′3″?
::3. 如果美国高中高空跳跃者最高跳跃高度的分布通常平均为511.5和2.2,那么看到高中跳跃者清晰度为63有多不寻常?If the mean is 5′11.5″, then 1 SD above is 6′1.7″ and 2 SD’s is 6′3.9″. That means that less than 2.5% of jumpers 6′3.9″, so it would be pretty uncommon to see a high-school competitor exceed 6′3″.
::如果平均值是 5'11.5,那么上面的1SD是 6'1.7,2SD是 6'3.9。 这意味着跳跃者中只有不到2.5% 6'3.9,所以看到一个高中竞争对手超过 6'3,这是非常罕见的。Earlier Problem Revisited
::重审先前的问题If you knew that the prices of t-shirts sold in an online shopping site were normally distributed , and had a mean cost of $10, with a standard deviation of $1.50, how could that information benefit you as you are looking at various t-shirt styles and designs on the site? How could you use what you know if you were looking to make a profit by purchasing unusually inexpensive shirts to resell at prices that are more common?
::如果你知道在网上购物网站出售的T恤衫的价格通常被分配,而且平均价格为10美元,标准差为1.50美元,那么,当你看到网站上的各种T恤衫样式和设计时,这种信息怎么会对你有利?如果你想要通过购买价格特别低廉的衬衫以更常见的价格转售而获利,你怎么能使用你所知道的东西呢?By knowing the mean and SD of the shirt prices, and knowing that they are normally distributed, you can estimate right away if a shirt is priced at a point significantly below the norm. For instance, with this data, we can estimate that a shirt priced at $7.00 is less expensive than apx 97.5% of all shirts on the site, and could likely be resold at a profit (assuming there is not something wrong the shirt that is not obvious from the listing).
::通过了解衬衫价格的平均值和SD,并且知道它们通常被分发,你可以立即估计衬衫的价格是否大大低于标准水平。 比如,根据这些数据,我们可以估计,以7.00美元计价的衬衫价格比工地上所有衬衫的97.5%低廉,并有可能以利润转售(假设上市时不明显不差的衬衫) 。Examples
::实例For questions 1-4, assume the data to be normally distributed, and describe the rarity of an event using the following scale: , , , ,
::对于问题1-4,假设数据正常分布,并用以下尺度描述事件频率:01%概率=非常罕见,15rare,534uncommon,3450common,50100Example 1
::例1If the mean of the data is 75, and the standard deviation is 5, how common is a value between 70 and 75?
::如果数据的平均值(微克)为75,而标准差(+12)为5,那么70至75之间的数值有多常见?A value of 70 is only 1 standard deviation below the mean, so a value between 70 and 75 would be expected approximately 34% of the time, so it would be common.
::70的值比平均值低1个标准差,因此,70至75之间的值预计大约占时间的34%,因此这是常见的。Example 2
::例2If the is .02 and the is .005, how common is a value between .005 and .01?
::如果 μ 是 . 02 , ° 3 =. 005, 那么 0. 005 和 . 01 之间的值有多常见 ?A value of .01 is 2 SD's below the mean, and .005 is 3 SD's below, so we would expect there to be about a 2.5% probability of a value occurring in that range. A value between 0.005 and 0.01 would be rare.
::0. 01 值是 2 SD 低于平均值, 0. 005 值是 3 SD 低于平均值, 因此我们预计该范围内值的概率大约为2.5%。 0.005 和 0.01 之间的值很少。Example 3
::例3If the is 1280 and the is 70, how common is a value between 1210 and 1350?
::如果 μ 是 1280 , 是 70 , 那么1210 和 1350 之间的值有多常见 ?1210 is 1 SD below the mean, and 1350 is 1 SD above the mean, so we would expect approximately 68% of the data to be in that range, meaning that is it likely that a value in that range would occur
::1210是1SD 低于平均值 1SD 1350是1SD 高于平均值 1SD 高于平均值 因此,我们预计大约68%的数据将处于这一范围, 也就是说,有可能出现该范围的值Example 4
::例4If the mean defect rate at a cellphone production plant is .1%, with a standard deviation of .03%, would it seem reasonable for a quality assurance manager to be concerned about 3 defective phones in a single 1000 unit run?]
::如果一个移动电话生产厂的平均缺陷率为1%,标准差为0.03%,质量保证经理是否有理由对单千个单位运行的3部有缺陷的电话表示关切? ].1% translates into 1 per thousand, with a standard deviation of 3 per ten thousand. That means that 3 defects in the same thousand is nearly 7 SD’s above the mean, well into the very rare category. While it is not impossible for random chance to result in such a value, it would certainly be prudent for the manager to investigate.
::1%转换为千分之一,标准偏差为万分之三。 这意味着同一千分之三的3个缺陷比平均值高出近7个SD,这非常罕见。 虽然随机机会并非不可能得出这样一个数值,但经理调查无疑是谨慎的。Review
::回顾Assume all sets/populations to be approximately normally distributed, and describe the rarity of an event using the following scale: , , , , . You may reference the image below:
::假设所有组/人口大致按正常分布,并用以下尺度描述事件的罕见性: 01% 概率=非常罕见, 15rare, 534uncommon, 3450common, 50100。 您可以参考以下图像 :-
Scores on a certain standardized test have a mean of 500, and a standard deviation of 100. How common is a score between 600 and 700?
::某种标准化测试的分数平均为500分,标准差为100分,600至700分有多常见? -
Considering a full-grown show-quality male Siberian Husky has a mean weight of 52.5 lbs, with SD of 7.5 lbs, how common are male huskies in the 37.5 – 45 lbs range?
::男性西伯利亚人Husky的平均体重为52.5磅,SD为7.5磅,37.5-45磅的男性华斯基人在37.5-45磅之间有多常见? -
A population
, and
, how common are values in the 100 – 150 range?
::人口 125 和 25, 值在100 - 150 范围有多常见? -
Population
and
, how common are values between 0.0025 and 0.0030?
::人口0.0025和0.0005, 0.0025和0.0030之间的数值有多常见? -
A 12 oz can of soda has a mean volume of 12 oz, with a standard deviation of .25 oz. How common are cans with between 11 and 11.5 oz of soda?
::12°C的苏打水平均体积为12°C,标准偏差为25°C。11°C至11°5°C的苏打水有多常见? -
and
, how common are values between 0.0045 and 0.005?
::0.0025 和 0.0005, 0.0045 和 0.005 之间的值有多常见? -
If a population
and
, how common are values between 0 and 1100?
::如果人口为1130和5,那么0至1100之间的数值有多常见? -
Assuming population
and
, how common are values between 1125 and 1135?
::假设人口为1130和5, 1125和1135之间的价值有多常见? -
The American Robin Redbreast has a mean weight of 77 g, with a standard deviation of 6 g. How common are Robins in the
range?
::美国Robin Red乳房的平均重量为77克,标准偏差为6克。 59g-71克范围内的Robin有多常见? -
Population
and
, how common are values between
and 1?
::人口35和110, 25和1之间的价值观有多常见? -
Population
and
, how common are values between 0.35% and 0.45%?
::人口占0.25%和0.05%,0.35%和0.45%之间的数值有多常见? -
Population
and
, how common are values between 155 and 156?
::人口156.5和0.25, 155和156之间的数值有多常见?
Review (Answers)
::回顾(答复)Click to see the answer key or go to the Table of Contents and click on the Answer Key under the 'Other Versions' option.
::单击可查看答题键, 或转到目录中, 单击“ 其他版本” 选项下的答题键 。 -
Physical characteristics such as height, weight, arm or leg length, etc.