10.6 将其放在一起
章节大纲
-
Professor Reitz believes that she has more than 8″ of snow on her deck, if she takes the following measurements using a SRS, can she be 95% sure that the mean depth is greater than 8″?
::Reitz教授相信,她甲板上积雪超过8英寸, 如果她使用SRS进行以下测量, 她能否95%确定平均深度大于8英寸?7.92″, 8.3″, 7.98″, 8.12″, 8.31″, 8.05″, 8.27″
Look to the end of the lesson for the answer.
::寻找教训的结尾 以找到答案。Putting it Together
::将它放在一起By now, you have learned all you need to know to test some real-life hypotheses. You know how to calculate the mean of means , , the sample standard deviation , , and how to reference z and t scores. You are familiar with and confidence levels. You know when to use a z -test, and when to use a t -test, and you know the difference between a null and alternative hypothesis . If are unsure of your grasp of any of these concepts, return to the appropriate lesson and review before moving on, otherwise, let’s put it all together!
::现在,你已经学会了测试一些现实生活假设所需要的一切。你知道如何计算手段的平均值, x , 样本标准偏差, 以及如何引用z 和 t 评分。 你对z 和 t 评分很熟悉,信任度也很高。你知道何时使用z 测试,何时使用t 测试,你也知道无效假设和替代假设之间的区别。 如果不确定你对这些概念中的任何一个概念的掌握情况,那么在开始之前,回到适当的教训和审查上来,否则,让我们把它们都拼凑在一起!Just for reference, here are the formulas for calculating confidence intervals of t and z tests:
::仅供参考,这里是用来计算 t 和 z 测试的置信度间隔的公式:-
T
-test confidence
interval
::T- 测试置信度间隔 =x tα2( sn) -
Z
-test confidence interval
::Z 测试置信度间隔 =x za2n
The steps to test a single-mean hypothesis:
::检验单一平均假设的步骤:-
Choose an appropriate test:
-
Z
-test if
is known and if the
population
is known to be normal or
.
::如果知道 +++ ,人口为正常人口或n+++ 30,则进行 Z- 测试。 -
T
-test is
is unknown and/or
.
::T- 测试为 XIII 未知和/ 或 n<30 。
::选择一个合适的测试: 如果知道 + + , 并且已知人口为正常或 n + 30, 则进行 Z- 测试。 T- 测试为 + + + 和/ 或 n < 30 , 未知 和/ 或 n < 30 。 -
Z
-test if
is known and if the
population
is known to be normal or
.
-
Identify your
::身份识别 -
Identify or calculate any needed values, probably
or
, and
.
::识别或计算任何需要的值, 可能 x, sor- 和 n。 -
Find the
Z
or
T
score of the
sample mean
.
::找出样本平均值的 Z 或 T 分数 。 -
Draw a curve, mark your critical value(s), and shade
(the rejection region), based on the appropriate number of tails in your test.
::绘制曲线,根据测试中适当的尾巴数量,标记您的关键值和阴影α(拒绝区域)。 -
Decide to reject or fail to reject the
null hypothesis
.
::决定拒绝或不拒绝无效假设。 -
Interpret your results.
::解释你的结果。
Real-World Application: Pizza
::真实世界应用:披萨You have been asked to determine if the mean weight of cheese use on the large pizzas at Speedy G’s is indeed 5 oz, as it should be. After sampling 87 large pizzas with a SRS, you have calculated and . Is the mean cheese weight correct? Show your work.
::有人要求你确定在Speedy G的大型比萨饼上使用奶酪的平均重量是否是5oz。在用SRS对87个大比萨进行取样后,你计算了 x 4.86 oz 和 s= 27oz。 平均奶酪重量是否正确? 展示一下你的工作。
Let’s use the steps from the lesson as a reference:
::让我们用教训中的步骤作为参考:1. Since , we can use a z -test.
::1. 自30年起,我们可以使用Z-测试。2. The null hypothesis is that the cheese weight is 5 oz. The alternative hypothesis is that the cheese weight is not 5oz.
::2. 无效假设是奶酪重量为5oz, 另一种假设是奶酪重量不是5oz。In other words, null , alternative .
::换句话说,无5oz,替代5oz。3. We are given the values for and .
::3. 我们得到x:4.86oz:0.27oz和n:87的数值。4. The z -score for is but we do not know , the standard deviation for cheese weight company-wide, so we will use our “best guess” of , the standard deviation of our sample: :
::4. x 的z-score是x n,但我们不知道 , 整个公司奶酪重量的标准偏差, 所以我们将使用我们的 " 最佳猜测 " , 我们样本的标准偏差: s=27 oz:5. Draw a curve, mark your critical value(s), and shade (the rejection region), based on the appropriate number of tails in your test.
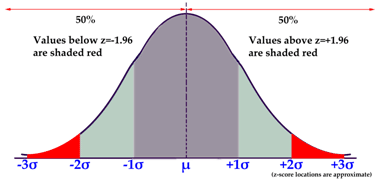
::5. 根据试验中适当的尾巴数量,绘制曲线,标记你的关键值和阴影α(拒绝区域)。Since there is no confidence level given, we assume 95%. Since this is a two-tail test, that gives us critical values of . If our sample mean has or , we may reject the null hypothesis.
::由于没有给定的置信度, 我们假设有95%。 由于这是一个双尾测试, 关键值为 1. 96。 如果我们的样本平均值是1. 96or1. 96, 我们可能会拒绝无效假设 。The Z -score of -4.84 of our sample mean is clearly well below the lower critical Z -score critical value of -1.96, in fact it would be well off to the left of our entire chart!
::我们样本平均值中的Z -4.84的Z分数显然远远低于 -1.96的低临界Z分数关键值,事实上它会非常接近我们整个图表的左边!6. Decide to reject or fail to reject the null hypothesis.
::6. 决定拒绝或不拒绝无效假设。Since the sample mean has a Z-score of -4.84, clearly not between the critical values of that we calculated from the 95% confidence level, we should reject the null hypothesis.
::由于样本平均值为 -4.84, 显然不是在我们根据95%的置信度 计算的关键值 1.96之间, 我们应该拒绝无效假设。7. Interpret your results.
::7. 解释你的结果。Since the data clearly suggests that we reject the null hypothesis, we reject the claim that the mean weight of cheese is 5 oz. If the mean weight of cheese really is 5 oz, our conclusions would have been extremely likely (about 1 in 1.5 million! ).
::由于数据清楚地表明我们拒绝无效假设,我们拒绝关于奶酪平均重量为5oz的说法。 如果奶酪平均重量为5oz,我们的结论极有可能(大约150万分之一! ) 。Real-World Application: Phone Data
::真实世界应用程序:电话数据Rachel collected an SRS of 70 people, asking how many texts they send per day on average , and calculated . Phone company data suggests that , and . Rachel thinks the actual mean is less than the phone company claims. Does Rachel’s sample data support her hypothesis?
::瑞秋收集了70人的SRS,询问他们每天平均发送多少文本,并计算了 x 42.72。 电话公司数据显示,45和8.瑞秋认为实际平均值低于电话公司声称的。 瑞秋的样本数据支持她的假设吗?Following the steps as outlined in the lesson :
::遵循经验教训中概述的步骤:1. Choose an appropriate test: Since , we can use a z -test (one-tail).
::1. 选择适当的试验:自第30次以来,我们可以使用z试验(一目了然)。2. State the null and alternate hypotheses:
::2. 说明无效假设和替代假设:Null:
::无效:________________________________________________________________________________________________________________________________________________________________________________________________________________________________________________________________Alternative:
::替代:_______________________________________________________________________________________________________________________________________________________________________________________________________________________________________________________________________________________________________________________________________________________________________________________________________________________________________________________________________________________________________________________________________3. Calculate any needed values:
::3. 计算任何需要的数值:We have what we need
::我们拥有我们需要的东西4. Find the Z or T score of the sample mean:
::4. 发现样本的Z或T分数系指:
::42.72 - 45870 2.2888.366 2.385. Draw a curve, mark your critical value(s), and shade (the rejection region), based on the appropriate number of tails in your test.
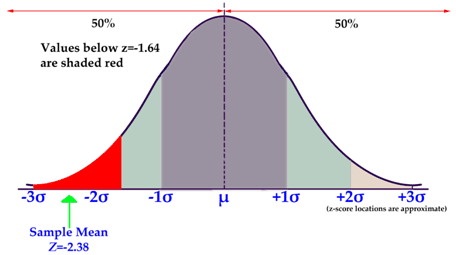
::5. 根据试验中适当的尾巴数量,绘制曲线,标记你的关键值和阴影α(拒绝区域)。6. Since there is no confidence level given, we assume 95%. Since this is a one-tail test, that gives us a critical value of . If our sample mean has , we may reject the null hypothesis.
::6. 由于没有给定的置信度,我们假定有95%的置信度,因为这是一个单尾试验,因此我们的关键值为1.645,如果我们的样本平均值是1.645,我们可能会拒绝无效假设。7. Decide to reject or fail to reject the null hypothesis.
::7. 决定拒绝或不拒绝无效假设。-
Since the sample mean has a
Z
-score of -2.38, well below the critical value of -1.645 that we calculated from the 95% confidence level, we can
reject the null hypothesis.
::由于样本平均值的Z分数为-2.38,远低于我们从95%的置信度水平计算出的1.645的关键值,我们可以拒绝无效假设。
8. Interpret your results.
::8. 解释你的结果。Since the data clearly suggests that we reject the null hypothesis, we can reject the claim that the mean number of texts per day is . If the mean number of texts per day were actually 45 or greater, Rachel’s conclusions would have a likelihood of 0.86%, well less than 5%.
::由于数据清楚地表明我们拒绝无效假设,我们可以拒绝每天平均文本数量为 45 的主张。 如果每天平均文本数量实际为45 或以上,瑞秋的结论有可能达到 0.86 % , 低于 5% 。Real-World Application: Price of Jeans
::现实世界应用:Jeans的价格An SRS of 51 of cheerleaders, asking how much they spend on a pair of jeans, yields . Department store data suggests that the average selling price of a pair of teen girl jeans is $40, with . Is it reasonable to reject the claim based on the research?
::51名啦啦队员的SRS询问他们花多少钱买牛仔裤,产量为38.77美元。 教育部的商店数据显示,一对少女牛仔裤的平均销售价格为40美元,4美元。 以研究为依据驳回这项索赔是否合理?Following the steps as outlined in the lesson :
::遵循经验教训中概述的步骤:1. Choose an appropriate test: Since , and we also know and , we can use a z -test (two-tail).
::1. 选择适当的试验:自第30次,而且我们也知道微和,我们可以使用z试验(双尾)。2. State the null and alternate hypotheses:
::2. 说明无效假设和替代假设:Null:
::无效: 40Alternative:
::替代品:___________________________________________________________________________________________________________________________________________________________________________________________________________________________________________________________________________________________________3. Calculate any needed values:
::3. 计算任何需要的数值:We have everything we need.
::我们拥有我们所需要的一切。4. Find the Z or T score of the sample mean:
::4. 发现样本的Z或T分数系指:
::38.77 - 400.560 1.230.560 2.25. Draw a curve, mark your critical value(s), and shade (the rejection region), based on the appropriate number of tails in your test.
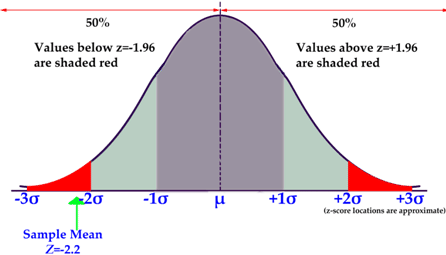
::5. 根据试验中适当的尾巴数量,绘制曲线,标记你的关键值和阴影α(拒绝区域)。Since there is no confidence level given, we assume 95%. Since this is a two-tail test, that gives us critical values of . If our sample mean has or , we may reject the null hypothesis.
::由于没有给定的置信度, 我们假设有95%。 由于这是一个双尾测试, 关键值为 1. 96。 如果我们的样本平均值是1. 96or1. 96, 我们可能会拒绝无效假设 。6. Decide to reject or fail to reject the null hypothesis.
::6. 决定拒绝或不拒绝无效假设。Since the sample mean has a Z -score of -2.2, below the critical value of -1.96 that we calculated from the 95% confidence level, we can reject the null hypothesis.
::由于样本平均值的Z分数为-2.2,低于我们从95%的置信度水平计算出的-1.96的临界值,我们可以拒绝无效假设。7. Interpret your results.
::7. 解释你的结果。Since the data suggests that we reject the null hypothesis, we can reject the claim that the mean cost of the jeans is actually $40. If the mean cost of the jeans was actually $40, our conclusions would have a likelihood of 1.4%, which is less than 5%.
::由于数据显示我们拒绝无效假设,我们可以拒绝牛仔裤平均成本实际为40美元的说法。 如果牛仔裤平均成本为40美元,那么我们的结论有可能达到1.4 % , 低于5%。Earlier Problem Revisited
::重审先前的问题Professor Reitz believes that she has more than 8″ of snow on her deck, if she takes the following measurements using a SRS, can she be 95% sure that the mean depth is greater than 8″?
::Reitz教授相信,她甲板上积雪超过8英寸, 如果她使用SRS进行以下测量, 她能否95%确定平均深度大于8英寸?7.92″, 8.3 ″, 7.98 ″ , 8.12 ″ , 8.31 ″ , 8.05 ″ , 8.27 ″
Technically, no, and the measurements actually do not matter. All she could state is that if she took 100 similar samples (7 data points each), 95 out of 100 of the samples would have a mean within two standard deviations of the actual mean.
::从技术上讲,没有,测量结果其实并不重要。 她只能说,如果她采集了100个相似的样本(每个样本7个数据点),每100个样本中95个样本的平均值在实际平均值的两个标准差之内。Examples
::实例A simple random sample of 32 homes were polled to see how many birds visited their back yard each summer day, yielding . The city claims that the nickname, “City of Birds” is appropriate, since homes in the city have an average of 60 or more birds in the back yard each summer day, with a standard deviation of 2. You are trying to prove that the claim is unjustified, because there are less than 60 birds in the back yard of the average home in the city.
::由32户家庭组成的简单随机抽样调查了32户家庭,以了解有多少鸟类在夏季日间游览后院,产生x 60.72鸟。 城市声称,绰号“鸟城”是合适的,因为城市家庭平均每夏日在后院平均有60或60多只鸟,标准偏差为2。 你试图证明这一说法是不合理的,因为城市平均家庭院子的后院只有不到60只鸟。Example 1
::例1What kind of test is appropriate in this instance?
::在这种情况下,什么样的检验是适当的?Since , and we know , a z -test is appropriate.
::自从30年,我们知道... . . . .Example 2
::例2What are the null and alternative hypotheses?
::什么是无效的和替代性的假设?
::H1:60,H0:60Example 3
::例3What is the value of ?
::S的价值是什么?
::232=0.3536Example 4
::例4What is the z-score of ?
::什么是X的Z分数?
::z=x 60.72-600.3536=2.04Example 5
::例5Assuming 95% CL, does the sampled data support your claim?
::假设95%的CL,抽样数据是否支持你的索赔?Since the z -score for the 95% of a one-tail test is -1.65, and the z -score of is 2.04, you cannot reject the null hypothesis, because you would need a z -score below -1.65. Therefore, you are unable to dispute the claim that there are greater than or equal to 60 birds, on average.
::由于95%的单尾试验的Z值是-165, 而x的z值是2.04, 你无法拒绝无效假设, 因为您需要的z值低于-165。 因此, 您无法质疑平均超过或等于60只鸟类的说法 。Review
::回顾Questions 1-4 refer to the following:
::问题1-4如下:A simple random sample of 59 third year college students were asked, on average, how much they spent for lunch, resulting in . The college claims that the students spend an average of $50 for lunch with a standard deviation of $6.
::对59名三年级大专学生的简单随机抽样调查平均询问他们午餐花费了多少,得出了48.29美元。 该学院声称,学生午餐平均花费50美元,标准差为6美元。1. Can the claim be viably tested with a Z -test? Why/Why not?
::1. 是否可以用Z测试来对索赔进行可靠的检验?为什么/为什么不能?2. What are and ?
::2. 什么是H0和H1?3. What is the Z -score of ?
::3. Z分数x是多少?4. Can you reject this claim using a significance level of 0.001?
::4. 您能否使用0.001这一重要水平来驳回这一索赔要求?Questions 5-10 refer to the following:
::问题5-10涉及以下方面:A simple random sample of 77 models were polled to learn how much they spent for a T-shirt, and got $43.33 on average. The models’ manager says that models in his company spend an average $45 with a standard deviation of $6. The polling company thinks the actual value is less than the manager claims.
::77种模式的简单随机抽样被抽查,以了解他们花在T恤衫上的钱,平均得到43.33美元。 模型经理说,在他的公司里,模型平均花费45美元,标准差为6美元。 投票公司认为实际价值低于经理的要求。5. Can the claim be viably tested with a Z -test? Why/Why not?
::5. 是否可以用Z测试来对索赔进行可靠的检验?为什么/为什么不能?6. What are and ?
::6. 什么是H0和H1?7. What is the Z -score of ?
::7. 什么是Z分数x?8. Can you reject this claim using a significance level of 0.05?
::8. 你能用0.05的重量级来驳回这一申诉吗?9. Can you say that you are 95% sure that the claim is correct?
::9. 你能说,你95%确定索赔正确无误吗?10. What can you say, with 95% confidence?
::10. 有95%的自信,你还能说什么?Questions 11-15 refer to the following:
::问题11-15涉及以下方面:A group of 26 high school seniors chosen via SRS were asked how many texts they make per day on average, yielding , with . The phone company states that the average high school senior sends an average of 45.
::电话公司说,平均高中毕业生平均发发发45份,平均发到45份。11. Can the claim be viably tested with a Z -test? Why/Why not?
::11. 是否可以用Z测试来对索赔进行可靠的检验?为什么/为什么不能?12. What are and ?
::12. 什么是H0和H1?13. What is the SEM ?
::13. 什么是SEM?14. How many are there?
::14. 有多少个DF?15. What is the T -score multiplier?
::15. T - 分数乘数是多少?16. What is the confidence interval ?
::16. 置信度间隔是多少?17. Can you reject this claim using a significance level of 0.05?
::17. 你能用0.05的重量级来驳回这一申诉吗?Review (Answers)
::回顾(答复)Click to see the answer key or go to the Table of Contents and click on the Answer Key under the 'Other Versions' option.
::单击可查看答题键, 或转到目录中, 单击“ 其他版本” 选项下的答题键 。 -
T
-test confidence
interval