11.2 线性关联
章节大纲
-
Suppose you have noted that your car seems to use more gas when you drive fast than when you drive more slowly. You decide to see how strong the relationship is, so you do some research, collect the data , and plot the data on the graph below, where the explanatory variable is mph, and the response variable is mpg. How can you describe how strong the correlation is without the graph?
::假设您已经注意到, 您的汽车在开快车时似乎使用更多的气体, 而不是在开慢车时使用更多的气体。 您决定看到关系有多强, 所以您可以做一些研究, 收集数据, 并在下图上绘制数据, 解释变量 x 是 mph , 响应变量 y 是 mpg 。 您如何描述没有图形, 相关性有多强 ?Linear Correlation Coefficient
::线性关联The linear correlation coefficient (sometimes called Pearson’s Correlation Coefficient), commonly denoted , is a measure of the strength of the linear relationship between two variables. The value of has the following properties:
::直线相关系数(有时称为皮尔逊的关联系数),通常称为r,是衡量两个变量之间线性关系强度的一个尺度。 r的值具有以下属性:-
is always a value between -1 and +1
::r 总是 -1 和 +1 之间的值 -
The further an
value is from zero, the stronger the relationship between the two variables.
::r 值从零越远,这两个变量之间的关系越强。 -
The sign of
indicates the nature of the relationship: A positive
indicates a positive relationship, and a negative
indicates a negative relationship.
::r 表示关系的性质:正 r 表示积极关系,负 r 表示消极关系。
Generally speaking, you may think of the values of in the following manner:
::一般而言,你可以用下列方式思考r的值:-
If
is between 0.85 and 1, there is a
strong correlation
.
::若在0.85到1之间, -
If
is between 0.5 and 0.85, there is a moderate correlation.
::若在0.5至0.85之间, -
If
is between 0.1 and 0.5, there is a
weak correlation
.
::若在0.1至0.5之间, -
If
is less than 0.1, there is no apparent correlation.
::如果“r”小于0.1,则没有明显的相关性。
Naturally, -value can be calculated, but the formula is a bit beyond the scope of this course. Fortunately, there are many excellent and free online calculators for determining the -value of a set of data. In this lesson we will be using the one on Easy Calculations' website, but a search for “correlation calculator online” will yield the most current options.
::自然,r值是可以计算出来的,但公式有点超出这个课程的范围。 幸运的是,有许多极好的免费在线计算器可以确定一组数据的r值。 在这一教训中,我们将使用“简单计算”网站的“简单计算”网站,但搜索“在线电算器”将产生最新的选项。At the risk of overloading you with new terms, there is one more that I think it is worth learning in this lesson, the coefficient of determination . The coefficient of determination is very simple to calculate if you know the correlation coefficient , since it is just . The reason I mention it is that the coefficient of determination can be interpreted as the percentage of variation of the variable that can be attributed to the relationship. In other words, a value of can be interpreted as “63% of the changes between one value and another can be attributed to y ’s relationship with ”.
::在可能给您带来新条件负担过重的风险中,还有一个问题,我认为值得在此教训中学习,即确定系数。如果您知道相关系数,确定系数非常简单,如果您知道相关系数,确定系数就很容易计算,因为它只是r2。 我提到的原因是,确定系数可以被解释为可归因于这种关系的 y 变量变化的百分比。换句话说,r2=.63 的值可以被解释为“一个 y 值和另一个 y 值之间变化的63%可归因于 y 与 x 的关系”。Drawing Conclusions Given R-Values
::鉴于R-价值的绘图结论1. Elaina is curious about the relationship between the weight of a dog and the amount of food it eats. Specifically, she wonders if heavier dogs eat more food, or if age and size factor in. She works at the Humane Society, and does some research. After some calculation, she determines that dog weight and food weight exhibit an -value of 0.73.
::1. Elaina对狗的体重和食物数量之间的关系感到好奇,具体地说,她想知道较重的狗是否食用更多的食物,或者是否年龄和大小因素,她在慈善协会工作,并做了一些研究,经过一些计算,她确定狗的重量和食物重量值为0.73卢比。
What can Elaina say about the relationship, based on her research? What percentage of the increases in food intake can she attribute to weight, according to her research?
::Elaina根据她的研究,对这种关系有什么看法?根据她的研究,她可以将食物摄入量增加的多少比例归因于重量?根据她的研究,她可以将增加多少比例归因于重量?The calculated -value of 0.73 tells us that Elaina’s data demonstrates a moderate to strong correlation between the variables.
::计算出的0.73的r值告诉我们,Elaina的数据显示变量之间有中度至强度的相互关系。Since the coefficient of determination tells us the percentage of changes in the output variable that can be attributed to the input variable, we need to calculate :
::由于确定系数告诉我们产出变量中可归因于输入变量的变化的百分比,我们需要计算 r2:
::r2=(0.732=.5329)Approximately 53% of increases in food intake can be attributed to the linear relationship between food intake and the weight of the dog, suggesting that other factors, perhaps age and size, are also involved.
::食物摄取量增加约53%,可归因于食物摄取量与狗体重之间的线性关系,这表明其他因素,也许包括年龄和体积。2. Tuscany wonders if barrel racing times are related to the age of the horse. Specifically, she wonders if older horses take longer to complete a barrel racing run. As a member of the Pony Club, she does some research, and determines that horse age to barrel run time exhibits an -value of 0.52.
::2. 托斯卡尼问桶尾赛跑时间是否与马的年龄有关,具体地说,她问老马完成桶尾赛跑需要更长的时间,作为小马俱乐部的成员,她做了一些研究,确定马的枪尾赛时间年龄为0.52瑞郎。What can Tuscany say about horse age vs barrel race time, according to her research?
::托斯卡尼根据她的研究 如何看待马年龄和枪管赛跑时间?Tuscany’s research suggests that there is a moderate to weak correlation between horse age and barrel run time. In other words, the research suggests that of the differences between barrel run times could be attributable to the linear relationship between barrel run time and the age of the horse.
::托斯卡尼的研究表明,马龄和桶运行时间之间有中度或微弱的相互关系。 换句话说,研究表明,桶运行时间之间差异的0.522=27=27 % 可能归因于桶运行时间和马龄之间的线性关系。Determining the Linear Correlation Coefficient of Determination
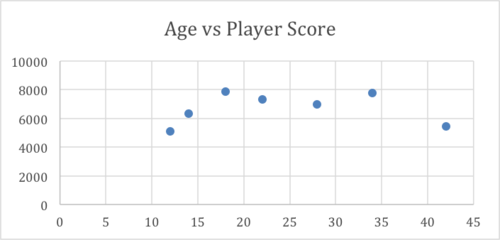
::确定线性关系关联的确定效率Sayber has collected the following data regarding player score vs age in his favorite online game. He suspects that increased age is not a good indicator of gaming ability. What are the linear correlation coefficient and coefficient of determination values of his data, and how do they support or not support Sayber’s hypothesis?
::Sayber收集了他最喜欢的网上游戏中玩家得分与年龄的下列数据。 他怀疑年龄的增长并不是赌博能力的好指标。 他的数据的线性相关系数和确定值系数是什么,它们如何支持或不支持Sayber的假设?Age
::年龄年龄Avg. Player Score
::Avg. 玩家分数12
5,120
14
6,328
18
7,892
22
7,340
28
6,987
34
7,750
42
5,421
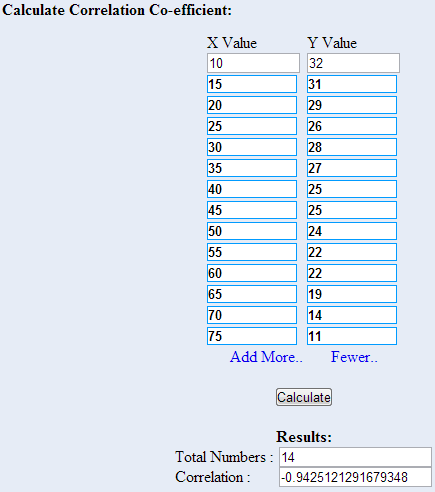
Let’s use the online calculator at Easy Calculation's website for this one.
::使用Easy Economic网站的在线计算器来计算。I entered the explanatory (Age) and response (Player Score) values into the calculator:
::我将解释(年龄)和回应(层分)值输入计算器:The linear correlation coefficient of approximately 0.04 suggests that there is no appreciable linear correlation . The coefficient of determination of 0.0016 suggests that perhaps 0.16% (practically none) of the variability of the player score is dependent on age.
::线性相关系数约为0.04,表明没有明显的线性相关系数。 确定0.0016的系数表明,玩家分数的0.16%(实际上没有)取决于年龄。Looking at the scores, however, something seems a miss with our findings. The scores suggest that age has no bearing on player score, but look at the graph of the same data:
::然而,看得分看,我们发现的结果似乎有些失落。 得分表明年龄对玩家得分没有影响,但看看同一数据的图表:The graph suggests that the youngest and oldest polled players score less than players in late teens to mid-thirties, which seems reasonable.
::该图显示,最年轻和最古老的授标球员在十几岁到三十年代中期的得分低于球员,这似乎是合理的。This is an important example of the weakness of using just one indicator of the relationship between two variables. As I noted early in the lesson, the - value is only an indicator of linear correlation, it says nothing at all about other kinds of variable relationships. It is always a good idea to review your data in different ways to evaluate your initial conclusions.
::这是仅使用两个变量之间关系的一个指标的弱点的一个重要例子。 正如我在早期的教训中指出的那样, r值只是线性相关性的指标, 它丝毫没有提及其他类型的变量关系。 以不同方式审查你的数据以评价你的初步结论总是一个好主意。Earlier Problem Revisited
::重审先前的问题Suppose you have noted that your car seems to use more gas when you drive fast than when you drive more slowly. You decide to see how strong the relationship is, so you do some research, collect the data, and plot the data on the graph below, where the explanatory variable is mph, and the response variable is mpg. How can you describe how strong the correlation is without the graph?
::假设您已经注意到, 您的汽车在开快车时似乎使用更多的气体, 而不是在开慢车时使用更多的气体。 您决定看到关系有多强, 所以您可以做一些研究, 收集数据, 并在下图上绘制数据, 解释变量是 mph , 反应变量是 mpg 。 您如何描述没有图形, 相关性有多强 ?After the lesson above, we know that the -value or -value of the relationship between MPG and MPH would describe the strength of the linear relationship in a single value.
::在吸取了上述教训之后,我们知道,MPG和MPH之间关系的r值或r2值将用一个单一值来描述线性关系的强度。By taking the data points detailed on the graph (in practice, of course, I would have had them in table format already, since I would have needed them to build the graph in the first place), and entering them into a free online, I get an -value of -.943 , indicating a strong negative relationship. This also translates into an -value of , indicating that the research suggests that approximately 89% of the decrease in MPG from left to right across the graph can be attributed to the increase in MPH.
::通过使用图表上详细列出的数据点(实际上,当然,我本来已经用表格格式列出数据点,因为首先我需要它们来建立图表),然后将数据点输入一个免费的在线系统,我得到的R值为-943,表明存在强烈的负关系。这还转化为r2值为(-0.9432=0.89),表明研究表明,从图中从左到右的MPG下降约89%可归因于公共卫生和公共卫生部的增加。Examples
::实例Example 1
::例1What can you say about the strength of a linear relationship with a -value of -0.87
::关于线性关系与R值 -0.87的强度,你能说什么?An of > 0.85 indicates a strong linear relationship. The fact that is negative indicates that as increases, decreases.
::大于 0.85 的 r 表示强烈的线性关系。 r 是负的, 表示随着 x 的增加, y 减少 。Example 2
::例2What can you say about the level of negative correlation of a relationship if you know the coefficient of determination is 0.82?
::如果你知道确定系数是0.82,那么对于某种关系的负相关程度,你能说些什么?Nothing! The coefficient of determination is , and therefore always positive. We know that , so this is a strong linear correlation, but we have no idea if it is positive or negative.
::没有!确定系数是R2,因此总是正数。我们知道\\\\\\\\\\\\\\\\\\\\\\\\\\\\\\\\\\\\\\\\\\\\\\\\\\\\\\\\\\\\\\\\\\\\\\\\\\\\\\\\\\\\\\\\\\\\\\\\\\\\\\\\\\\\\\\\\\\\\\\\\\\\\\\\\\\\\\\\\\\\\\\\\\\\\\\\\\\\\\\\\\\\\\\\\\\\\\\\\\\\\\\\\\\\\\\\\\\\\\\\\\\\\\\\\\\\\\\\\\\\\\\\\\\\\\\\\\\\\\\\\\\\\\\\\\\\\\\\\\\\\\\\\\\\\\\\\\\\\\\\\\\\\\\\\\\\\\\\\\\\\\\\\\\\\\\\\\\\\\\\\\\\\\\\\\\\\\\\\\\\\\\\\\\\\\\\\\\\\\\\\\\\\\\\\\\\\\\\\\\\\\\\\\\\\\\\\\\\\\\\\\\\\\\\\\\\\\\\\\\\\\\\\\\\\\\\\\\\\\\\\\\\\\\\\\\\\\\\\\\\\\\\\\\\\\\\\\\\\\\\\\\\\\\\\\\\\\\Example 3
::例3How much of the variability of is attributable to in a relationship with an -value of 0.76?
::在R值为0.76的关系中, y 的变异有多少可归因于 x ?The coefficient of determination describes the variation in attributable to , so we need to find . Approximately 57.76% of the change in -values can be attributed to the change in .
::确定系数说明可归因于x的y值变化,因此我们需要找到r20.762)=.5776。 y值变化的大约57.76%可归因于x的变化。
Review
::回顾For questions 1-5, describe the relationship based on the -value.
::对于问题1至5,根据r-value说明关系。1.
::1. r=02.
::2. r=0.913.
::3. r0.494.
::4. r=0.055.
::5. r=1For questions 6-10, describe the relationship based on the coefficient of determination:
::关于问题6-10,说明基于确定系数的关系:6.
::6. r2=0.827.
::7. r2=0.158.
::8 r2=0.479.
::9. r2=110.
::10. r2=0Questions 11-15 refer to the data in the following table:
::问题11-15指下表的数据:
::X 十
::Y Y Y5
70
7
69
13
58
22
47
36
36
38
25
45
14
11. What is the linear correlation coefficient of the data?
::11. 数据的线性相关系数是什么?12. What does tell you about the relationship?
::12 r 告诉你什么关系?13. What is the value of the data?
::13. 数据的r2值是什么?14. What does the coefficient of determination tell you about this relationship?
::14. 关于这种关系,确定系数告诉你什么?15. What would a graph of the data look like?
::15. 数据图表将是什么样子?Review (Answers)
::回顾(答复)Click to see the answer key or go to the Table of Contents and click on the Answer Key under the 'Other Versions' option.
::单击可查看答题键, 或转到目录中, 单击“ 其他版本” 选项下的答题键 。 -
is always a value between -1 and +1